


-
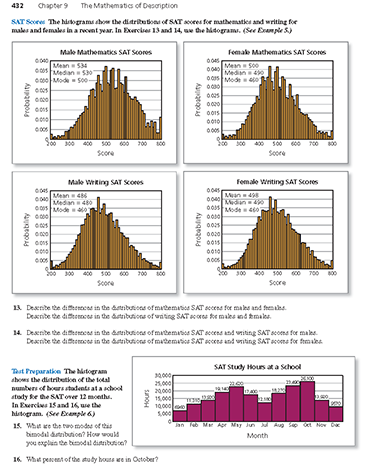
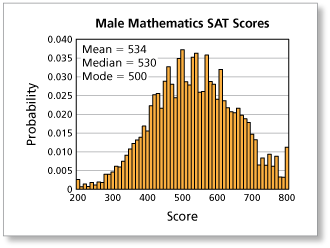
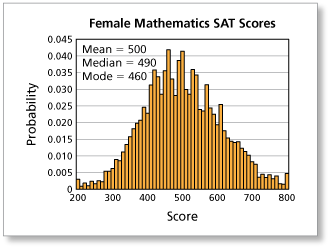
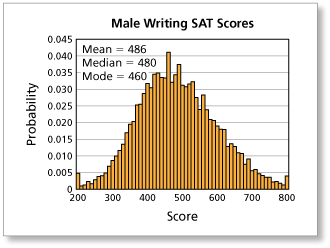
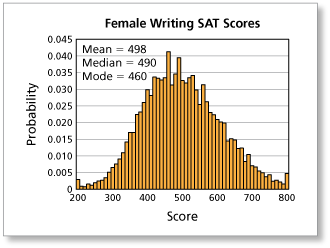
The histograms show the distributions of SAT scores for mathematics and writing for males and females in a recent year. Describe the differences in the distributions of mathematics SAT scores for males and females. Describe the differences in the distributions of writing SAT scores for males and females. (See Example 5.)
-
From the graphs, you can see that males tend to have higher mathematics SAT scores than females. Females tend to have higher writing SAT scores than males.
Comments (0)These comments are not screened before publication. Constructive debate about the information on this page is welcome, but personal attacks are not. Please do not post comments that are commercial in nature or that violate copyright. Comments that we regard as obscene, defamatory, or intended to incite violence will be removed. If you find a comment offensive, you may flag it.
When posting a comment, you agree to our Terms of Use.Showing 0 commentsSubscribe by email Subscribe by RSSThere are no comments. -
-
The histograms show the distributions of SAT scores for mathematics and writing for males and females in a recent year. Describe the differences in the distributions of mathematics SAT scores and writing SAT scores for males. Describe the differences in the distributions of mathematics SAT scores and writing SAT scores for females. (See Example 5.)
These comments are not screened before publication. Constructive debate about the information on this page is welcome, but personal attacks are not. Please do not post comments that are commercial in nature or that violate copyright. Comments that we regard as obscene, defamatory, or intended to incite violence will be removed. If you find a comment offensive, you may flag it.
When posting a comment, you agree to our Terms of Use. -
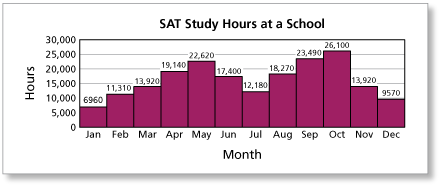
The histogram shows the distribution of the total numbers of hours students at a school study for the SAT over 12 months. What are the two modes of this bimodal distribution? How would you explain the bimodal distribution? (See Example 6.)
-
The two peak months that students study more for the SAT are May and October, so May and October are the two modes of this bimodal distribution. Typically, students will take the SAT in May, June, October, or November. This would account for the higher number of study hours in the months before, and the lower number of study hours in January, July, and December.
These comments are not screened before publication. Constructive debate about the information on this page is welcome, but personal attacks are not. Please do not post comments that are commercial in nature or that violate copyright. Comments that we regard as obscene, defamatory, or intended to incite violence will be removed. If you find a comment offensive, you may flag it.
When posting a comment, you agree to our Terms of Use. -
-
The histogram shows the distribution of the total numbers of hours students at a school study for the SAT over 12 months. What percent of the study hours are in October? (See Example 6)
These comments are not screened before publication. Constructive debate about the information on this page is welcome, but personal attacks are not. Please do not post comments that are commercial in nature or that violate copyright. Comments that we regard as obscene, defamatory, or intended to incite violence will be removed. If you find a comment offensive, you may flag it.
When posting a comment, you agree to our Terms of Use.