


-
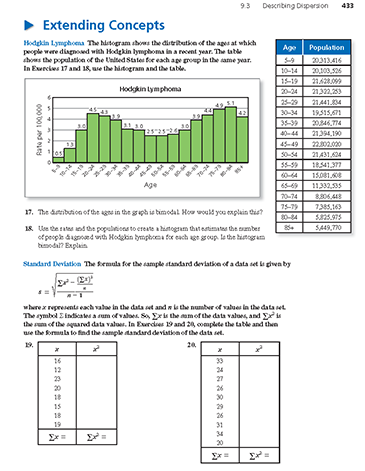
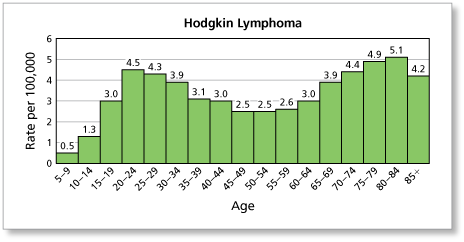
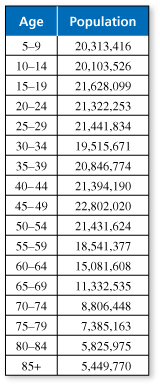
The histogram shows the distribution of the ages at which people were diagnosed with Hodgkin lymphoma in a recent year. The table shows the population of the United States for each age group in a recent year. The distribution of the ages is bimodal. How would you explain this?
-
Sample answer:
One possible reason may be that children who were not exposed to infectious disease at a young age were more susceptible to the diseases in early adulthood and the diseases were much worse than they would have been if the people had gotten them in childhood. And, for the older mode, it may be related to a weakening of the immune system.
Comments (0)These comments are not screened before publication. Constructive debate about the information on this page is welcome, but personal attacks are not. Please do not post comments that are commercial in nature or that violate copyright. Comments that we regard as obscene, defamatory, or intended to incite violence will be removed. If you find a comment offensive, you may flag it.
When posting a comment, you agree to our Terms of Use.Showing 0 commentsSubscribe by email Subscribe by RSSThere are no comments. -
-
The histogram shows the distribution of the ages at which people were diagnosed with Hodgkin lymphoma in a recent year. The table shows the population of the United States for each age group in a recent year. Use the rates and the populations to create a histogram that estimates the number of people diagnosed with Hodgkin lymphoma for each age group. Is the histogram bimodal? Explain.
These comments are not screened before publication. Constructive debate about the information on this page is welcome, but personal attacks are not. Please do not post comments that are commercial in nature or that violate copyright. Comments that we regard as obscene, defamatory, or intended to incite violence will be removed. If you find a comment offensive, you may flag it.
When posting a comment, you agree to our Terms of Use. -
The formula for the sample standard deviation of a data set is given by
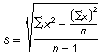
where x represents each value in the data set and n is the number of values in the data set. The symbol ∑ indicates a sum of values. So,
 is the sum of the data values, and
  is the sum of the squared data values. Complete the table and then use the formula to find the sample standard deviation of the data set.
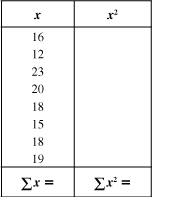
-
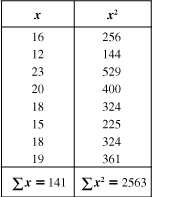
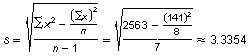
So, the sample standard deviation of the data set is about 3.3.
These comments are not screened before publication. Constructive debate about the information on this page is welcome, but personal attacks are not. Please do not post comments that are commercial in nature or that violate copyright. Comments that we regard as obscene, defamatory, or intended to incite violence will be removed. If you find a comment offensive, you may flag it.
When posting a comment, you agree to our Terms of Use. -
-
The formula for the sample standard deviation of a data set is given by
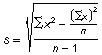
where x represents each value in the data set and n is the number of values in the data set. The symbol Σ indicates a sum of values. So,
 is the sum of the data values and
  is the sum of the squared data values. Complete the table and then use the formula to find the sample standard deviation of the data set.
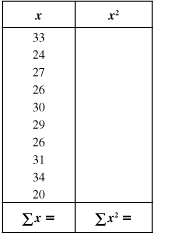
These comments are not screened before publication. Constructive debate about the information on this page is welcome, but personal attacks are not. Please do not post comments that are commercial in nature or that violate copyright. Comments that we regard as obscene, defamatory, or intended to incite violence will be removed. If you find a comment offensive, you may flag it.
When posting a comment, you agree to our Terms of Use.