


-
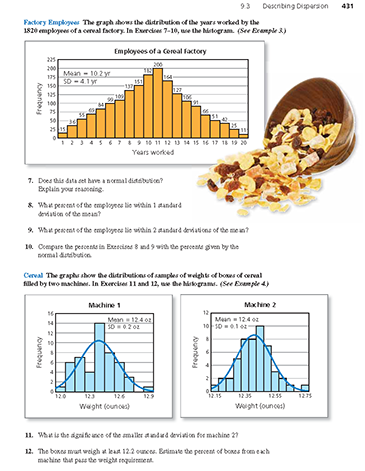
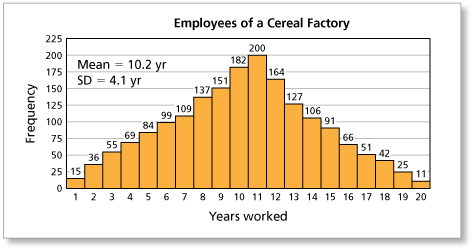
The histogram shows the distribution of the years worked by the 1820 employees of a cereal factory. Does this data set have a normal distribution? Explain your reasoning. (See Example 3.)
-
The distribution of the data is approximately bell-shaped, so it appears to have a normal distribution.
Comments (0)These comments are not screened before publication. Constructive debate about the information on this page is welcome, but personal attacks are not. Please do not post comments that are commercial in nature or that violate copyright. Comments that we regard as obscene, defamatory, or intended to incite violence will be removed. If you find a comment offensive, you may flag it.
When posting a comment, you agree to our Terms of Use.Showing 0 commentsSubscribe by email Subscribe by RSSThere are no comments. -
-
The histogram shows the distribution of the years worked by the 1820 employees of a cereal factory. What percent of the employees lie within 1 standard deviation of the mean? (See Example 3.)
These comments are not screened before publication. Constructive debate about the information on this page is welcome, but personal attacks are not. Please do not post comments that are commercial in nature or that violate copyright. Comments that we regard as obscene, defamatory, or intended to incite violence will be removed. If you find a comment offensive, you may flag it.
When posting a comment, you agree to our Terms of Use. -
The histogram shows the distribution of the years worked by the 1820 employees of a cereal factory. What percent of the employees lie within 2 standard deviations of the mean? (See Example 3.)
-
The mean is about 10 years and the standard deviation is about 4 years. Data values that lie within 2 standard deviations lie within the range 10 - 2(4) to 10 + 2(4), or from 2 years to 18 years.
Add the number of employees who have years within the range from 2 years to 18 years. The number of employees with years worked within 2 standard deviations of the mean is

Divide this number by the total number of employees.

So, about 97% of the employees have years that lie within 2 standard deviations of the mean.
These comments are not screened before publication. Constructive debate about the information on this page is welcome, but personal attacks are not. Please do not post comments that are commercial in nature or that violate copyright. Comments that we regard as obscene, defamatory, or intended to incite violence will be removed. If you find a comment offensive, you may flag it.
When posting a comment, you agree to our Terms of Use. -
-
The histogram shows the distribution of the years worked by the 1820 employees of a cereal factory. Compare the percents in Exercises 8 and 9 with the percents given by the normal distribution. (See Example 3.)
These comments are not screened before publication. Constructive debate about the information on this page is welcome, but personal attacks are not. Please do not post comments that are commercial in nature or that violate copyright. Comments that we regard as obscene, defamatory, or intended to incite violence will be removed. If you find a comment offensive, you may flag it.
When posting a comment, you agree to our Terms of Use. -
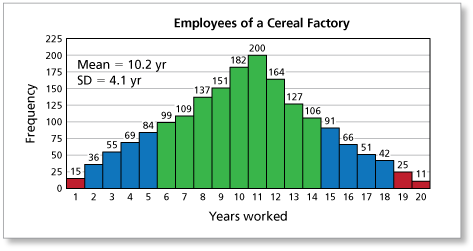
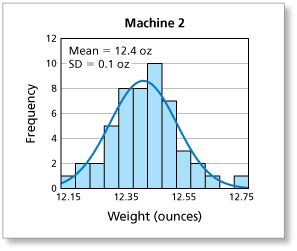
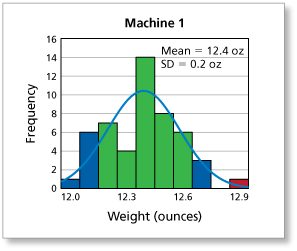
The histograms show the distributions of samples of weights of boxes of cereal filled by two machines. What is the significance of the smaller standard deviation for machine 2? (See Example 4.)
-
The smaller standard deviation for machine 2 means that the distribution of data values for machine 2 has less dispersion than the distribution of the data values for machine 1. In other words, the weights in machine 2's distribution are more tightly clustered about the mean than the weights in machine 1's distribution.
These comments are not screened before publication. Constructive debate about the information on this page is welcome, but personal attacks are not. Please do not post comments that are commercial in nature or that violate copyright. Comments that we regard as obscene, defamatory, or intended to incite violence will be removed. If you find a comment offensive, you may flag it.
When posting a comment, you agree to our Terms of Use. -
-
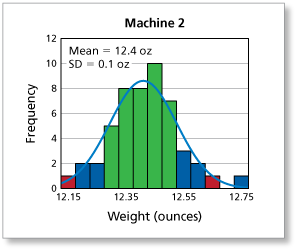
The histograms show the distributions of samples of weights of boxes of cereal filled by two machines. The boxes must weigh at least 12.2 ounces. Estimate the percent of boxes from each machine that pass the weight requirement. (See Example 4.)
These comments are not screened before publication. Constructive debate about the information on this page is welcome, but personal attacks are not. Please do not post comments that are commercial in nature or that violate copyright. Comments that we regard as obscene, defamatory, or intended to incite violence will be removed. If you find a comment offensive, you may flag it.
When posting a comment, you agree to our Terms of Use.