


-
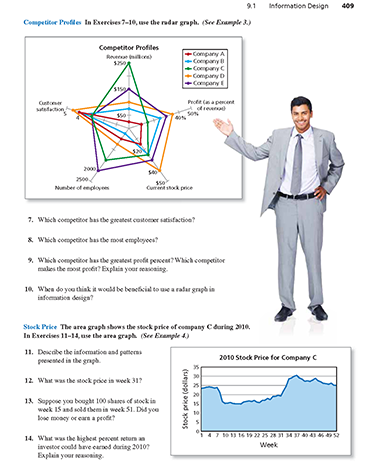
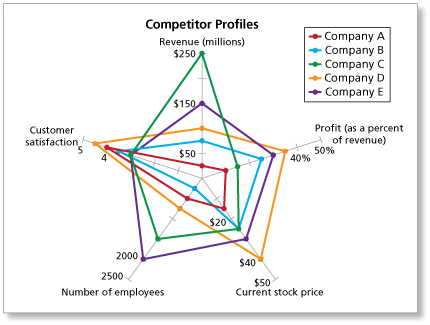
Which competitor has the greatest customer satisfaction? (See Example 3.)
-
To find the competitor with the greatest customer satisfaction, determine which colored graph intersects the branch labeled "Customer satisfaction" farthest from the center. Company D (represented by the orange graph) has the greatest customer satisfaction, with a rating of about 4.5.
Comments (0)These comments are not screened before publication. Constructive debate about the information on this page is welcome, but personal attacks are not. Please do not post comments that are commercial in nature or that violate copyright. Comments that we regard as obscene, defamatory, or intended to incite violence will be removed. If you find a comment offensive, you may flag it.
When posting a comment, you agree to our Terms of Use.Showing 0 commentsSubscribe by email Subscribe by RSSThere are no comments. -
-
Which competitor has the most employees? (See Example 3.)
These comments are not screened before publication. Constructive debate about the information on this page is welcome, but personal attacks are not. Please do not post comments that are commercial in nature or that violate copyright. Comments that we regard as obscene, defamatory, or intended to incite violence will be removed. If you find a comment offensive, you may flag it.
When posting a comment, you agree to our Terms of Use. -
Which competitor has the greatest profit percent? Which competitor makes the most profit? Explain your reasoning. (See Example 3.)
-
The graph of company D (represented by the orange graph) intersects the branch labeled Profit farthest from the center, so the competitor with the greatest profit percent is company D.
To determine the profit for each company, multiply the revenue by the profit percent (in decimal form) for the company.
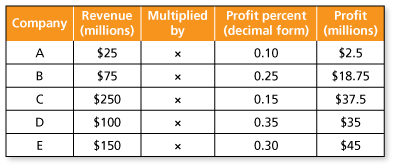
Compare the results to determine which competitor makes the most profit. Company E makes the most profit, $45 million. Although company D has the greatest profit percent, company C and company E both have greater profits than company D because of greater revenues.
These comments are not screened before publication. Constructive debate about the information on this page is welcome, but personal attacks are not. Please do not post comments that are commercial in nature or that violate copyright. Comments that we regard as obscene, defamatory, or intended to incite violence will be removed. If you find a comment offensive, you may flag it.
When posting a comment, you agree to our Terms of Use. -
-
When do you think it would be beneficial to use a radar graph in information design? (See Example 3.)
These comments are not screened before publication. Constructive debate about the information on this page is welcome, but personal attacks are not. Please do not post comments that are commercial in nature or that violate copyright. Comments that we regard as obscene, defamatory, or intended to incite violence will be removed. If you find a comment offensive, you may flag it.
When posting a comment, you agree to our Terms of Use. -
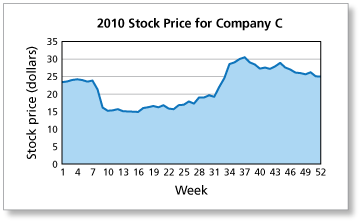
The area graph shows the stock price of company C during 2010. Describe the information and patterns presented in the graph. (See Example 4.)
-
The area graph shows the price of a share of company C stock through 2010. The price stayed close to $24 through the first 6 weeks of 2010. The price dropped significantly during the next two or three weeks and then settled at about $15 through week 16. The price increased modestly from week 16 through week 31, when it reached nearly $20. The price increased more rapidly from week 31 through week 37 when it peaked at just over $30. From week 37 on, the strongest trend was a slow decrease in price to about $25 at the end of 2010.
These comments are not screened before publication. Constructive debate about the information on this page is welcome, but personal attacks are not. Please do not post comments that are commercial in nature or that violate copyright. Comments that we regard as obscene, defamatory, or intended to incite violence will be removed. If you find a comment offensive, you may flag it.
When posting a comment, you agree to our Terms of Use. -
-
The area graph shows the stock price of company C during 2010. What was the stock price in week 31? (See Example 4.)
These comments are not screened before publication. Constructive debate about the information on this page is welcome, but personal attacks are not. Please do not post comments that are commercial in nature or that violate copyright. Comments that we regard as obscene, defamatory, or intended to incite violence will be removed. If you find a comment offensive, you may flag it.
When posting a comment, you agree to our Terms of Use.Showing 1 comments Guest 3 years ago |Based in the graph the stock price on week 31 was slightly below $20.00 a share.0 0
 -
The area graph shows the stock price of company C during 2010. Suppose you bought 100 shares of stock in week 15 and sold them in week 51. Did you lose money or earn a profit? (See Example 4.)
-
The prices for one share of stock are shown by the graph to be about $15 in week 15 and about $25 in week 51. Because you sold the shares for about $10 per share more than you paid for them, you made a profit on the 100 shares of about 10(100) = $1000.
These comments are not screened before publication. Constructive debate about the information on this page is welcome, but personal attacks are not. Please do not post comments that are commercial in nature or that violate copyright. Comments that we regard as obscene, defamatory, or intended to incite violence will be removed. If you find a comment offensive, you may flag it.
When posting a comment, you agree to our Terms of Use. -
-
The area graph shows the stock price of company C during 2010. What was the highest percent return an investor could have earned during 2010? Explain your reasoning. (See Example 4.)
These comments are not screened before publication. Constructive debate about the information on this page is welcome, but personal attacks are not. Please do not post comments that are commercial in nature or that violate copyright. Comments that we regard as obscene, defamatory, or intended to incite violence will be removed. If you find a comment offensive, you may flag it.
When posting a comment, you agree to our Terms of Use.