


-
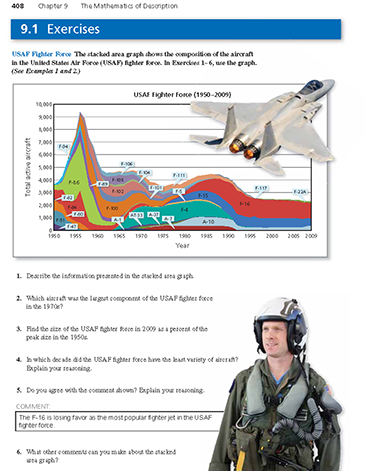
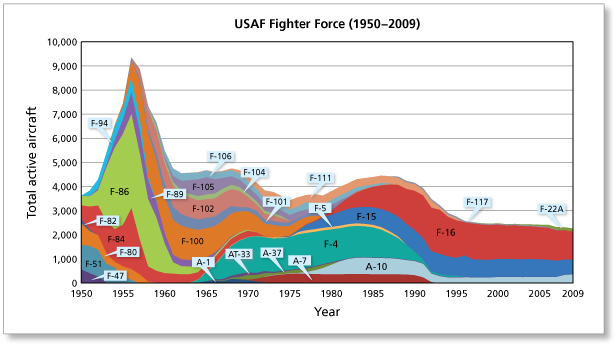
The stacked area graph shows the composition of the aircraft in the United States Air Force (USAF) fighter force. Describe the information presented in the stacked area graph. (See Example 1 and Example 2.)
-
The vertical axis represents numbers of aircraft and the horizontal axis represents the years from 1950 through 2009. Each shaded region represents the numbers of a given model of aircraft used by the USAF fighter force. Here are some observations.
- The total number of aircraft peaked in the mid-1950s.
- About one-half of the aircraft in use have been F-16s since the early 1990s.
- The number of F-15s in use has been fairly constant since the early 1980s.
- There were nearly 4000 F-85s in use in the mid-1950s.
- The total number of aircraft increased from the mid-1970s through the mid 1980s, but then decreased steadily from that time on.
- There were more F-4s than any other type of aircraft in use from the late 1960s through the mid-1980s.
Comments (1)These comments are not screened before publication. Constructive debate about the information on this page is welcome, but personal attacks are not. Please do not post comments that are commercial in nature or that violate copyright. Comments that we regard as obscene, defamatory, or intended to incite violence will be removed. If you find a comment offensive, you may flag it.
When posting a comment, you agree to our Terms of Use.Showing 1 commentsSubscribe by email Subscribe by RSS Ron Larson (author)1 decade ago |I love this graph. I saw it in an Air Force publication in a doctor's office. When I asked whether I could photocopy the graph, my doctor said "Just take the whole magazine."1 0
 -
-
The stacked area graph shows the composition of the aircraft in the United States Air Force (USAF) fighter force. Which aircraft was the largest component of the USAF fighter force in the 1970s? (See Example 1 and Example 2.)
These comments are not screened before publication. Constructive debate about the information on this page is welcome, but personal attacks are not. Please do not post comments that are commercial in nature or that violate copyright. Comments that we regard as obscene, defamatory, or intended to incite violence will be removed. If you find a comment offensive, you may flag it.
When posting a comment, you agree to our Terms of Use. -
The stacked area graph shows the composition of the aircraft in the United States Air Force (USAF) fighter force. Find the size of the USAF fighter force in 2009 as a percent of the peak size in the 1950s. (See Example 1 and Example 2.)
-
To find the size of the USAF fighter force in 2009 as a percent of the peak size in the 1950s, use the graph to estimate the number of aircraft at these times and divide the number of aircraft in 2009 by the peak number in the 1950s.

In terms of the number of aircraft, the size of the USAF fighter force in 2009 was only about 24% of its peak size in the 1950s. The steepness of the curves near the peak in the graph reflects a change in philosophy from "quantity" to "quality." They bought great numbers of aircraft with short life spans in the early 1950s, but started purchasing smaller numbers of aircraft with longer life spans in the mid-1950s.
These comments are not screened before publication. Constructive debate about the information on this page is welcome, but personal attacks are not. Please do not post comments that are commercial in nature or that violate copyright. Comments that we regard as obscene, defamatory, or intended to incite violence will be removed. If you find a comment offensive, you may flag it.
When posting a comment, you agree to our Terms of Use. -
-
The stacked area graph shows the composition of the aircraft in the United States Air Force (USAF) fighter force. In which decade did the USAF fighter force have the least variety of aircraft? Explain your reasoning. (See Example 1 and Example 2.)
These comments are not screened before publication. Constructive debate about the information on this page is welcome, but personal attacks are not. Please do not post comments that are commercial in nature or that violate copyright. Comments that we regard as obscene, defamatory, or intended to incite violence will be removed. If you find a comment offensive, you may flag it.
When posting a comment, you agree to our Terms of Use. -
The stacked area graph shows the composition of the aircraft in the United States Air Force (USAF) fighter force. Do you agree with the comment? Explain your reasoning. (See Example 1 and Example 2.)
-
The graph shows that the F-16 has decreased slightly in number since 2000, but the total number of aircraft in the fighting force has decreased as well. Because F-16s still make up about one-half of the fighting force, the graph does not give enough evidence to support the comment that the F-16 is losing favor as the most popular fighter jet in the USAF fighter force.
These comments are not screened before publication. Constructive debate about the information on this page is welcome, but personal attacks are not. Please do not post comments that are commercial in nature or that violate copyright. Comments that we regard as obscene, defamatory, or intended to incite violence will be removed. If you find a comment offensive, you may flag it.
When posting a comment, you agree to our Terms of Use. -
-
The stacked area graph shows the composition of the aircraft in the United States Air Force (USAF) fighter force. What other comments can you make about the stacked area graph? (See Example 1 and Example 2.)
These comments are not screened before publication. Constructive debate about the information on this page is welcome, but personal attacks are not. Please do not post comments that are commercial in nature or that violate copyright. Comments that we regard as obscene, defamatory, or intended to incite violence will be removed. If you find a comment offensive, you may flag it.
When posting a comment, you agree to our Terms of Use.