


-
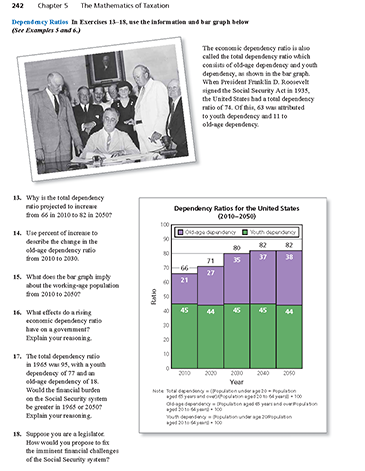
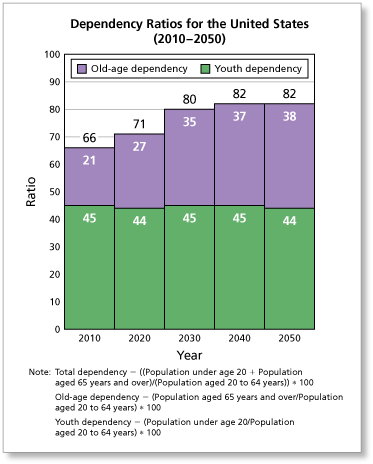
The economic dependency ratio is also called the total dependency ratio which consists of old-age dependency and youth dependency, as shown in the bar graph. When President Franklin D. Roosevelt signed the Social Security Act in 1935, the United States had a total dependency ratio of 74. Of this, 63 was attributed to youth dependency and 11 to old-age dependency.
Why is the total dependency ratio projected to increase from 66 in 2010 to 82 in 2050? (See Example 5 and Example 6.)
-
One possible reason for the total dependency ratio to increase is that people are projected to live longer.
Comments (0)These comments are not screened before publication. Constructive debate about the information on this page is welcome, but personal attacks are not. Please do not post comments that are commercial in nature or that violate copyright. Comments that we regard as obscene, defamatory, or intended to incite violence will be removed. If you find a comment offensive, you may flag it.
When posting a comment, you agree to our Terms of Use.Showing 0 commentsSubscribe by email Subscribe by RSSThere are no comments. -
-
The economic dependency ratio is also called the total dependency ratio which consists of old-age dependency and youth dependency, as shown in the bar graph. When President Franklin D. Roosevelt signed the Social Security Act in 1935, the United States had a total dependency ratio of 74. Of this, 63 was attributed to youth dependency and 11 to old-age dependency.
Use percent of increase to describe the change in the old-age dependency ratio from 2010 to 2030. (See Example 5 and Example 6.)
These comments are not screened before publication. Constructive debate about the information on this page is welcome, but personal attacks are not. Please do not post comments that are commercial in nature or that violate copyright. Comments that we regard as obscene, defamatory, or intended to incite violence will be removed. If you find a comment offensive, you may flag it.
When posting a comment, you agree to our Terms of Use. -
The economic dependency ratio is also called the total dependency ratio which consists of old-age dependency and youth dependency, as shown in the bar graph. When President Franklin D. Roosevelt signed the Social Security Act in 1935, the United States had a total dependency ratio of 74. Of this, 63 was attributed to youth dependency and 11 to old-age dependency.
What does the bar graph imply about the working-age population from 2010 to 2050? (See Example 5 and Example 6.)
-
The number of young people is remaining relatively constant. So, the number of working-age people will also be remaining relatively constant.
These comments are not screened before publication. Constructive debate about the information on this page is welcome, but personal attacks are not. Please do not post comments that are commercial in nature or that violate copyright. Comments that we regard as obscene, defamatory, or intended to incite violence will be removed. If you find a comment offensive, you may flag it.
When posting a comment, you agree to our Terms of Use. -
-
The economic dependency ratio is also called the total dependency ratio which consists of old-age dependency and youth dependency, as shown in the bar graph. When President Franklin D. Roosevelt signed the Social Security Act in 1935, the United States had a total dependency ratio of 74. Of this, 63 was attributed to youth dependency and 11 to old-age dependency.
What effects do a rising economic dependency ratio have on a government? Explain your reasoning. (See Example 5 and Example 6.)
These comments are not screened before publication. Constructive debate about the information on this page is welcome, but personal attacks are not. Please do not post comments that are commercial in nature or that violate copyright. Comments that we regard as obscene, defamatory, or intended to incite violence will be removed. If you find a comment offensive, you may flag it.
When posting a comment, you agree to our Terms of Use. -
The economic dependency ratio is also called the total dependency ratio which consists of old-age dependency and youth dependency, as shown in the bar graph. When President Franklin D. Roosevelt signed the Social Security Act in 1935, the United States had a total dependency ratio of 74. Of this, 63 was attributed to youth dependency and 11 to old-age dependency.
The total dependency ratio in 1965 was 95, with a youth dependency of 77 and an old-age dependency of 18. Would the financial burden on the Social Security system be greater in 1965 or 2050? Explain your reasoning. (See Example 5 and Example 6.)
-
There will be a much greater burden on Social Security in 2050 than there was in 1965. The primary reason is that in 1965 there were more workers to support each retired person.
These comments are not screened before publication. Constructive debate about the information on this page is welcome, but personal attacks are not. Please do not post comments that are commercial in nature or that violate copyright. Comments that we regard as obscene, defamatory, or intended to incite violence will be removed. If you find a comment offensive, you may flag it.
When posting a comment, you agree to our Terms of Use. -
-
The economic dependency ratio is also called the total dependency ratio which consists of old-age dependency and youth dependency, as shown in the bar graph. When President Franklin D. Roosevelt signed the Social Security Act in 1935, the United States had a total dependency ratio of 74. Of this, 63 was attributed to youth dependency and 11 to old-age dependency.
Suppose you are a legislator. How would you propose to fix the imminent financial challenges of the Social Security system? (See Example 5 and Example 6.)
These comments are not screened before publication. Constructive debate about the information on this page is welcome, but personal attacks are not. Please do not post comments that are commercial in nature or that violate copyright. Comments that we regard as obscene, defamatory, or intended to incite violence will be removed. If you find a comment offensive, you may flag it.
When posting a comment, you agree to our Terms of Use.