


-
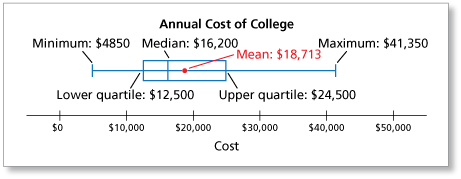
The box-and-whisker plot shows the annual cost for undergraduate tuition, room, and board at 21 public and private colleges.
How many colleges have an annual cost between $12,500 and $24,500? (See Example 3.)
-
About 25% of the data in the box-and-whisker plot are between the lower quartile ($12,500) and the median. About 25% of the data are between the median and the upper quartile ($24,500). So, about 50% of the 21 colleges have an annual cost of between $12,500 and $24,500.
About 10 or 11 of the colleges have an annual cost of between $12,500 and $24,500.
Comments (0)These comments are not screened before publication. Constructive debate about the information on this page is welcome, but personal attacks are not. Please do not post comments that are commercial in nature or that violate copyright. Comments that we regard as obscene, defamatory, or intended to incite violence will be removed. If you find a comment offensive, you may flag it.
When posting a comment, you agree to our Terms of Use.Showing 0 commentsSubscribe by email Subscribe by RSSThere are no comments. -
-
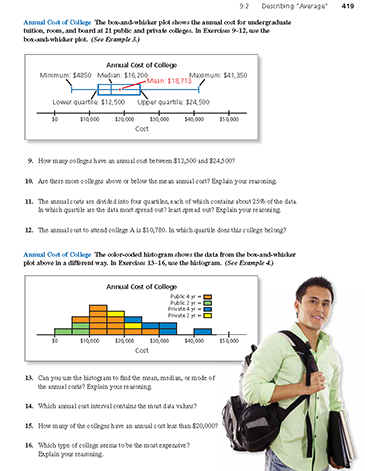
The box-and-whisker plot shows the annual cost for undergraduate tuition, room, and board at 21 public and private colleges. Are there more colleges above or below the mean annual cost? Explain your reasoning. (See Example 3.)
These comments are not screened before publication. Constructive debate about the information on this page is welcome, but personal attacks are not. Please do not post comments that are commercial in nature or that violate copyright. Comments that we regard as obscene, defamatory, or intended to incite violence will be removed. If you find a comment offensive, you may flag it.
When posting a comment, you agree to our Terms of Use. -
The box-and-whisker plot shows the annual cost for undergraduate tuition, room, and board at 21 public and private colleges.
The annual costs are divided into four quartiles, each of which contains about 25% of the data. In which quartile are the data most spread out? least spread out? Explain your reasoning. (See Example 3.)
-
The quartile of the data that is most spread out has the greatest range of values. The quartile of the data that is least spread out has the least range of values. You can see visually from the box-and-whisker plot that the uppermost quartile of the data has the greatest range of values and the lower middle quartile has the least range of values. Verify this using the values given in the box-and-whisker plot.
Range of values of lowest quartile: $12,500 - $4850 = $7650
Range of values of lower middle quartile: $16,200 - $12,500 = $3700
Range of values of upper middle quartile: $24,500 - $16,200 = $8700
Range of values of uppermost quartile: $41,350 - $24,500 = $16,450
The uppermost quartile of the data has the greatest range of values ($16,450) and the lower middle quartile of the data has the least range of values ($3700).
The data in the uppermost quartile is the most spread out. The data in the lower middle quartile is the least spread out.
These comments are not screened before publication. Constructive debate about the information on this page is welcome, but personal attacks are not. Please do not post comments that are commercial in nature or that violate copyright. Comments that we regard as obscene, defamatory, or intended to incite violence will be removed. If you find a comment offensive, you may flag it.
When posting a comment, you agree to our Terms of Use. -
-
The box-and-whisker plot shows the annual cost for undergraduate tuition, room, and board at 21 public and private colleges. The annual cost to attend college A is $10,780. In which quartile does this college belong? (See Example 3.)
These comments are not screened before publication. Constructive debate about the information on this page is welcome, but personal attacks are not. Please do not post comments that are commercial in nature or that violate copyright. Comments that we regard as obscene, defamatory, or intended to incite violence will be removed. If you find a comment offensive, you may flag it.
When posting a comment, you agree to our Terms of Use. -
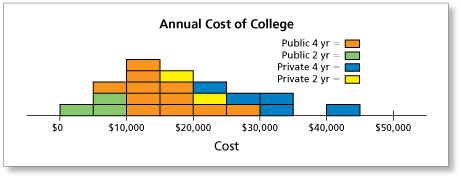
The color-coded histogram shows the annual cost for undergraduate tuition, room, and board at 21 public and private colleges. Can you use the histogram to find the mean, median, or mode of the annual costs? Explain your reasoning. (See Example 4.)
-
The histogram shows the $5000 interval in which the annual cost for each college occurs, rather than the actual cost. This information cannot be used to determine the sum of the actual annual costs, so you cannot use the histogram to find the mean. Also, without knowing the actual values, you cannot determine the middle value, nor can you determine the most common value.
You cannot use the histogram to find the mean, median, or mode of the annual costs.
These comments are not screened before publication. Constructive debate about the information on this page is welcome, but personal attacks are not. Please do not post comments that are commercial in nature or that violate copyright. Comments that we regard as obscene, defamatory, or intended to incite violence will be removed. If you find a comment offensive, you may flag it.
When posting a comment, you agree to our Terms of Use. -
-
The color-coded histogram shows the annual cost for undergraduate tuition, room, and board at 21 public and private colleges. Which annual cost interval contains the most data values? (See Example 4.)
These comments are not screened before publication. Constructive debate about the information on this page is welcome, but personal attacks are not. Please do not post comments that are commercial in nature or that violate copyright. Comments that we regard as obscene, defamatory, or intended to incite violence will be removed. If you find a comment offensive, you may flag it.
When posting a comment, you agree to our Terms of Use. -
The color-coded histogram shows the annual cost for undergraduate tuition, room, and board at 21 public and private colleges. How many of the colleges have an annual cost less than $20,000? (See Example 4.)
-
To find the number of the colleges that have an annual cost less than $20,000, count the number of colored rectangles to the left of $20,000 in the histogram. There are 13 of these rectangles.
The annual cost at 13 of the colleges is less than $20,000.
These comments are not screened before publication. Constructive debate about the information on this page is welcome, but personal attacks are not. Please do not post comments that are commercial in nature or that violate copyright. Comments that we regard as obscene, defamatory, or intended to incite violence will be removed. If you find a comment offensive, you may flag it.
When posting a comment, you agree to our Terms of Use. -
-
The color-coded histogram shows the annual cost for undergraduate tuition, room, and board at 21 public and private colleges. Which type of college seems to be the most expensive? Explain your reasoning. (See Example 4.)
These comments are not screened before publication. Constructive debate about the information on this page is welcome, but personal attacks are not. Please do not post comments that are commercial in nature or that violate copyright. Comments that we regard as obscene, defamatory, or intended to incite violence will be removed. If you find a comment offensive, you may flag it.
When posting a comment, you agree to our Terms of Use.