-
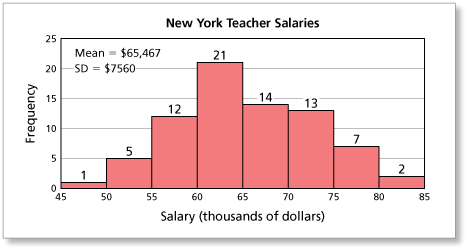
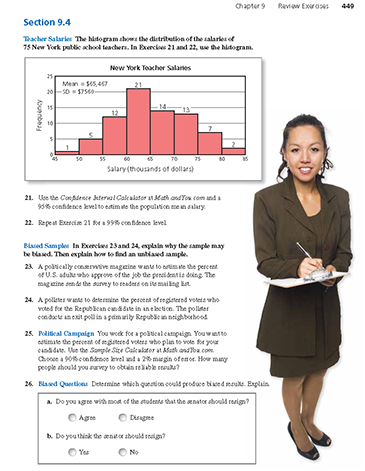
The histogram shows the distribution of the salaries of 75 New York public school teachers. Use the Confidence Interval Calculator and a 95% confidence level to estimate the population mean salary.

-
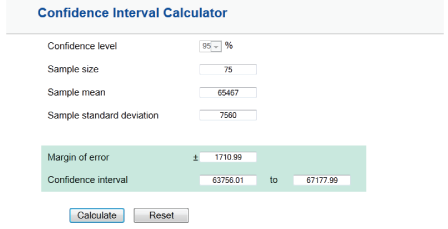
Using the Confidence Interval Calculator located in Tools, you can obtain the following.
- 95% Confidence Level: The population mean is $65,467 ± $1710.99.

Comments (0)These comments are not screened before publication. Constructive debate about the information on this page is welcome, but personal attacks are not. Please do not post comments that are commercial in nature or that violate copyright. Comments that we regard as obscene, defamatory, or intended to incite violence will be removed. If you find a comment offensive, you may flag it.
When posting a comment, you agree to our Terms of Use.Showing 0 commentsSubscribe by email Subscribe by RSSThere are no comments. -
-
The histogram shows the distribution of the salaries of 75 New York public school teachers. Use the Confidence Interval Calculator and a 99% confidence level to estimate the population mean salary.

These comments are not screened before publication. Constructive debate about the information on this page is welcome, but personal attacks are not. Please do not post comments that are commercial in nature or that violate copyright. Comments that we regard as obscene, defamatory, or intended to incite violence will be removed. If you find a comment offensive, you may flag it.
When posting a comment, you agree to our Terms of Use. -
Explain why the sample may be biased. Then explain how to find an unbiased sample.
A politically conservative magazine wants to estimate the percent of U.S. adults who approve of the job the president is doing. The magazine sends the survey to readers on its mailing list.
-
The sample may be biased because conservative people would have a positive opinion of a conservative president and a negative opinion of a liberal president. To find an unbiased sample, the magazine should send the survey to a random sample of people.
These comments are not screened before publication. Constructive debate about the information on this page is welcome, but personal attacks are not. Please do not post comments that are commercial in nature or that violate copyright. Comments that we regard as obscene, defamatory, or intended to incite violence will be removed. If you find a comment offensive, you may flag it.
When posting a comment, you agree to our Terms of Use. -
-
Explain why the sample may be biased. Then explain how to find an unbiased sample.
A pollster wants to determine the percent of registered voters who voted for the Republican candidate in an election. The pollster conducts an exit poll in a primarily Republican neighborhood.
These comments are not screened before publication. Constructive debate about the information on this page is welcome, but personal attacks are not. Please do not post comments that are commercial in nature or that violate copyright. Comments that we regard as obscene, defamatory, or intended to incite violence will be removed. If you find a comment offensive, you may flag it.
When posting a comment, you agree to our Terms of Use. -
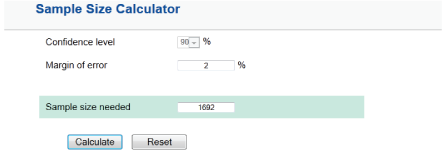
You work for a political campaign. You want to estimate the percent of registered voters who plan to vote for your candidate. Use the Sample Size Calculator. Choose a 90% confidence level and a 2% margin of error. How many people should you survey to obtain reliable results?
-
Using the Sample Size Calculator located in Tools, you can see that you need to survey 1692 people to obtain reliable results.

These comments are not screened before publication. Constructive debate about the information on this page is welcome, but personal attacks are not. Please do not post comments that are commercial in nature or that violate copyright. Comments that we regard as obscene, defamatory, or intended to incite violence will be removed. If you find a comment offensive, you may flag it.
When posting a comment, you agree to our Terms of Use. -
-
Determine which question could produce biased results. Explain.

These comments are not screened before publication. Constructive debate about the information on this page is welcome, but personal attacks are not. Please do not post comments that are commercial in nature or that violate copyright. Comments that we regard as obscene, defamatory, or intended to incite violence will be removed. If you find a comment offensive, you may flag it.
When posting a comment, you agree to our Terms of Use.


