


-
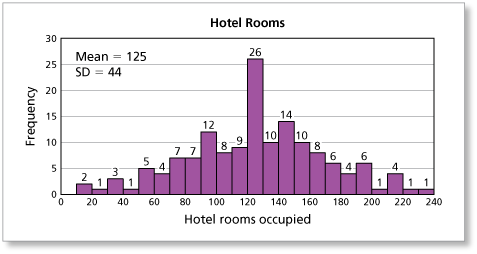
The histogram shows the distribution of the numbers of hotel rooms occupied for 150 days in a year. Does this data set have a normal distribution? Explain your reasoning.
-
The shape of the distribution is approximately bell-shaped, so the data appears to have a normal distribution.
Comments (0)These comments are not screened before publication. Constructive debate about the information on this page is welcome, but personal attacks are not. Please do not post comments that are commercial in nature or that violate copyright. Comments that we regard as obscene, defamatory, or intended to incite violence will be removed. If you find a comment offensive, you may flag it.
When posting a comment, you agree to our Terms of Use.Showing 0 commentsSubscribe by email Subscribe by RSSThere are no comments. -
-
The histogram shows the distribution of the numbers of hotel rooms occupied for 150 days in a year. What percent of the days lie within 1 standard deviation of the mean?
These comments are not screened before publication. Constructive debate about the information on this page is welcome, but personal attacks are not. Please do not post comments that are commercial in nature or that violate copyright. Comments that we regard as obscene, defamatory, or intended to incite violence will be removed. If you find a comment offensive, you may flag it.
When posting a comment, you agree to our Terms of Use. -
The histogram shows the distribution of the numbers of hotel rooms occupied for 150 days in a year. What percent of the days lie within 2 standard deviations of the mean?
-
The mean is 125 hotel rooms occupied and the standard deviation is 44 hotel rooms occupied. Data values that lie within 2 standard deviations lie within the range 125 - 2(44) to 125 + 2(44), or 37 rooms to 213 rooms. Rounding to the nearest 10 gives a range of 40 to 210 rooms.
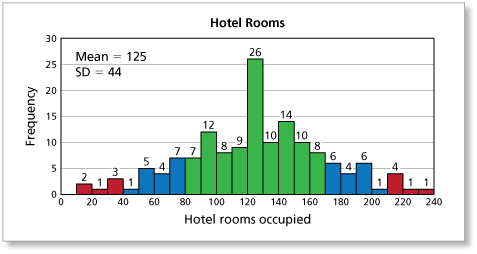
Add the days with numbers of hotel rooms occupied within the range from 40 rooms to 210 rooms. The number of days with numbers of hotel rooms occupied within 2 standard deviations of the mean is

Divide this number by the total number of days.

So, about 92% of the days have numbers of rooms occupied that lie within 2 standard deviations of the mean.
These comments are not screened before publication. Constructive debate about the information on this page is welcome, but personal attacks are not. Please do not post comments that are commercial in nature or that violate copyright. Comments that we regard as obscene, defamatory, or intended to incite violence will be removed. If you find a comment offensive, you may flag it.
When posting a comment, you agree to our Terms of Use. -
-
The histogram shows the distribution of the numbers of hotel rooms occupied for 150 days in a year. Compare the percents in Exercises 16 and 17 with the percents given by the normal distribution.
These comments are not screened before publication. Constructive debate about the information on this page is welcome, but personal attacks are not. Please do not post comments that are commercial in nature or that violate copyright. Comments that we regard as obscene, defamatory, or intended to incite violence will be removed. If you find a comment offensive, you may flag it.
When posting a comment, you agree to our Terms of Use. -
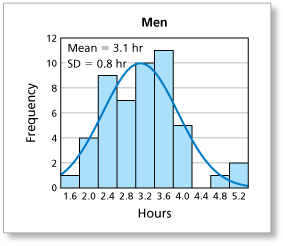
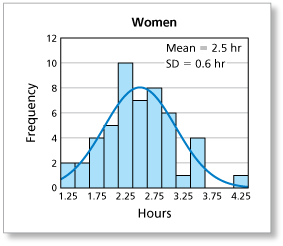
The histograms show the distributions of samples of hours of television watched per day by men and women. What is the significance of the smaller standard deviation for women?
-
The smaller standard deviation for women means that the distribution of data values for women has less dispersion than the distribution of data values for men. In other words, the hours of television watched in the distribution for women are more tightly clustered about the mean than the hours of television watched in the men's distribution.
These comments are not screened before publication. Constructive debate about the information on this page is welcome, but personal attacks are not. Please do not post comments that are commercial in nature or that violate copyright. Comments that we regard as obscene, defamatory, or intended to incite violence will be removed. If you find a comment offensive, you may flag it.
When posting a comment, you agree to our Terms of Use. -
-
The histograms show the distributions of samples of hours of television watched per day by men and women. Estimate the percents of men and women that watch at least 4 hours of television per day.
These comments are not screened before publication. Constructive debate about the information on this page is welcome, but personal attacks are not. Please do not post comments that are commercial in nature or that violate copyright. Comments that we regard as obscene, defamatory, or intended to incite violence will be removed. If you find a comment offensive, you may flag it.
When posting a comment, you agree to our Terms of Use.