


-
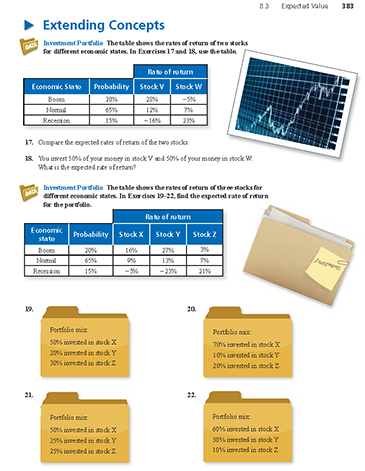
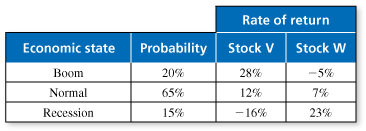
The table shows the rates of return of two stocks for different economic states. Compare the expected rates of return for the two stocks.

-
A spreadsheet helps to organize the calculations.
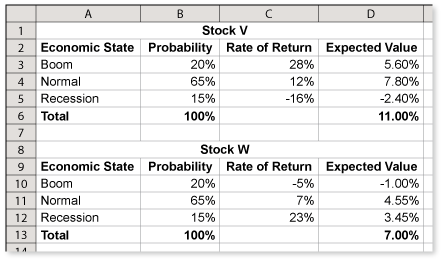
Stock V has the better expected value. Of course, if you expect a recession, then stock W is the better option.
Comments (0)These comments are not screened before publication. Constructive debate about the information on this page is welcome, but personal attacks are not. Please do not post comments that are commercial in nature or that violate copyright. Comments that we regard as obscene, defamatory, or intended to incite violence will be removed. If you find a comment offensive, you may flag it.
When posting a comment, you agree to our Terms of Use.Showing 0 commentsSubscribe by email Subscribe by RSSThere are no comments. -
-
The table shows the rates of return of two stocks for different economic states. You invest 50% of your money in stock V and 50% of your money in stock W. What is the expected rate of return?
These comments are not screened before publication. Constructive debate about the information on this page is welcome, but personal attacks are not. Please do not post comments that are commercial in nature or that violate copyright. Comments that we regard as obscene, defamatory, or intended to incite violence will be removed. If you find a comment offensive, you may flag it.
When posting a comment, you agree to our Terms of Use. -
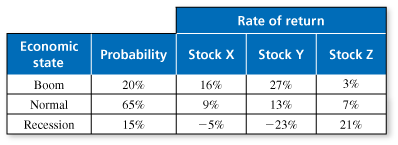
The table shows the rates of return of three stocks for different economic states. Find the expected rate of return for the portfolio.

-
A spreadsheet helps to organize the calculations.
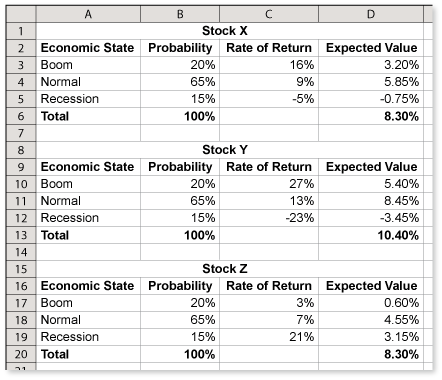
To find the rate of return for the portfolio, multiply each expected value by the percent in the portfolio.
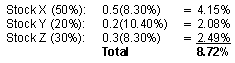
So, overall, this portfolio has a rate of return of 8.72%. Do you see the philosophy for building a portfolio? The general idea is to mix the different types of investments. By doing this, you don't usually get the best possible return, but you lessen your chance of a poor return or a loss.
These comments are not screened before publication. Constructive debate about the information on this page is welcome, but personal attacks are not. Please do not post comments that are commercial in nature or that violate copyright. Comments that we regard as obscene, defamatory, or intended to incite violence will be removed. If you find a comment offensive, you may flag it.
When posting a comment, you agree to our Terms of Use. -
-
The table shows the rates of return of three stocks for different economic states. Find the expected rate of return for the portfolio.
These comments are not screened before publication. Constructive debate about the information on this page is welcome, but personal attacks are not. Please do not post comments that are commercial in nature or that violate copyright. Comments that we regard as obscene, defamatory, or intended to incite violence will be removed. If you find a comment offensive, you may flag it.
When posting a comment, you agree to our Terms of Use. -
The table shows the rates of return of three stocks for different economic states. Find the expected rate of return for the portfolio.

-
A spreadsheet helps to organize the calculations.
To find the rate of return for the portfolio, multiply each expected value by the percent in the portfolio.
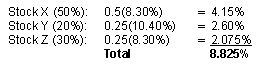
So, overall, this portfolio has a rate of return of 8.825%.
These comments are not screened before publication. Constructive debate about the information on this page is welcome, but personal attacks are not. Please do not post comments that are commercial in nature or that violate copyright. Comments that we regard as obscene, defamatory, or intended to incite violence will be removed. If you find a comment offensive, you may flag it.
When posting a comment, you agree to our Terms of Use. -
-
The table shows the rates of return of three stocks for different economic states. Find the expected rate of return for the portfolio.

These comments are not screened before publication. Constructive debate about the information on this page is welcome, but personal attacks are not. Please do not post comments that are commercial in nature or that violate copyright. Comments that we regard as obscene, defamatory, or intended to incite violence will be removed. If you find a comment offensive, you may flag it.
When posting a comment, you agree to our Terms of Use.