


-
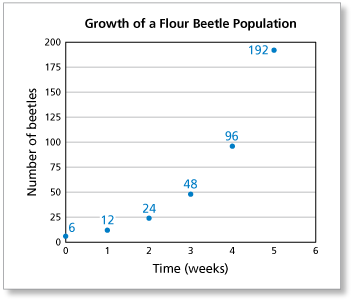
The graph shows the growth of a flour beetle population in a natural environment. At what rate is the flour beetle population increasing?

-
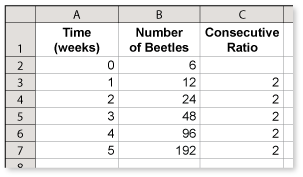
By making a spreadsheet of the data, you can see that the consecutive ratios are equal. This implies that the pattern is exponential. Moreover, the population is doubling every week.
Comments (0)These comments are not screened before publication. Constructive debate about the information on this page is welcome, but personal attacks are not. Please do not post comments that are commercial in nature or that violate copyright. Comments that we regard as obscene, defamatory, or intended to incite violence will be removed. If you find a comment offensive, you may flag it.
When posting a comment, you agree to our Terms of Use.Showing 0 commentsSubscribe by email Subscribe by RSSThere are no comments. -
-
The graph shows the growth of a flour beetle population in a natural environment. Predict the number of flour beetles in week 6.
These comments are not screened before publication. Constructive debate about the information on this page is welcome, but personal attacks are not. Please do not post comments that are commercial in nature or that violate copyright. Comments that we regard as obscene, defamatory, or intended to incite violence will be removed. If you find a comment offensive, you may flag it.
When posting a comment, you agree to our Terms of Use. -
The graph shows the growth of a flour beetle population in a natural environment. When does the population exceed 4000 beetles?
-
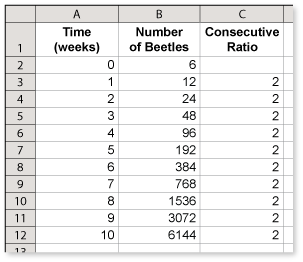
From the spreadsheet below, you can see that if the population continues to double every week, then the population of flour beetles will exceed 4000 in the 10th week.
These comments are not screened before publication. Constructive debate about the information on this page is welcome, but personal attacks are not. Please do not post comments that are commercial in nature or that violate copyright. Comments that we regard as obscene, defamatory, or intended to incite violence will be removed. If you find a comment offensive, you may flag it.
When posting a comment, you agree to our Terms of Use. -
-
The graph shows the growth of a flour beetle population in a natural environment. How many weeks does it take the population to quadruple?
These comments are not screened before publication. Constructive debate about the information on this page is welcome, but personal attacks are not. Please do not post comments that are commercial in nature or that violate copyright. Comments that we regard as obscene, defamatory, or intended to incite violence will be removed. If you find a comment offensive, you may flag it.
When posting a comment, you agree to our Terms of Use. -
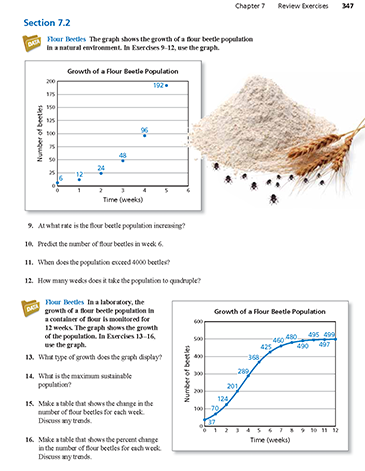
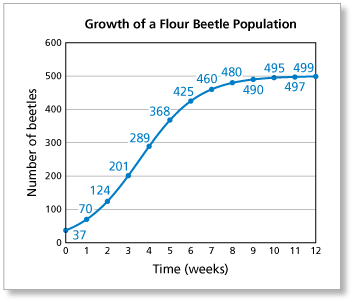
In a laboratory, the growth of a flour beetle population in a container of flour is monitored for 12 weeks. The graph shows the growth of the population. What type of growth does the graph display?
-
The graph is showing a logistic growth pattern.
These comments are not screened before publication. Constructive debate about the information on this page is welcome, but personal attacks are not. Please do not post comments that are commercial in nature or that violate copyright. Comments that we regard as obscene, defamatory, or intended to incite violence will be removed. If you find a comment offensive, you may flag it.
When posting a comment, you agree to our Terms of Use. -
-
In a laboratory, the growth of a flour beetle population in a container of flour is monitored for 12 weeks. The graph shows the growth of the population. What is the maximum sustainable population?
These comments are not screened before publication. Constructive debate about the information on this page is welcome, but personal attacks are not. Please do not post comments that are commercial in nature or that violate copyright. Comments that we regard as obscene, defamatory, or intended to incite violence will be removed. If you find a comment offensive, you may flag it.
When posting a comment, you agree to our Terms of Use. -
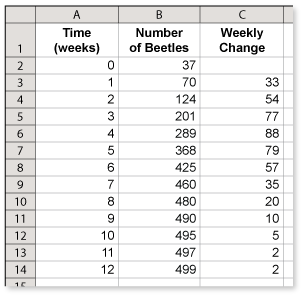
In a laboratory, the growth of a flour beetle population in a container of flour is monitored for 12 weeks. The graph shows the growth of the population. Make a table that shows the change in the number of flour beetles for each week. Discuss any trends.
-
Enter the data into a spreadsheet. Then, add a column that shows the weekly change. Notice that the change is increasing until Week 4. At that point, the growth rate starts to slow down.
These comments are not screened before publication. Constructive debate about the information on this page is welcome, but personal attacks are not. Please do not post comments that are commercial in nature or that violate copyright. Comments that we regard as obscene, defamatory, or intended to incite violence will be removed. If you find a comment offensive, you may flag it.
When posting a comment, you agree to our Terms of Use. -
-
In a laboratory, the growth of a flour beetle population in a container of flour is monitored for 12 weeks. The graph shows the growth of the population. Make a table that shows the percent change in the number of flour beetles for each week. Discuss any trends.
These comments are not screened before publication. Constructive debate about the information on this page is welcome, but personal attacks are not. Please do not post comments that are commercial in nature or that violate copyright. Comments that we regard as obscene, defamatory, or intended to incite violence will be removed. If you find a comment offensive, you may flag it.
When posting a comment, you agree to our Terms of Use.