


-
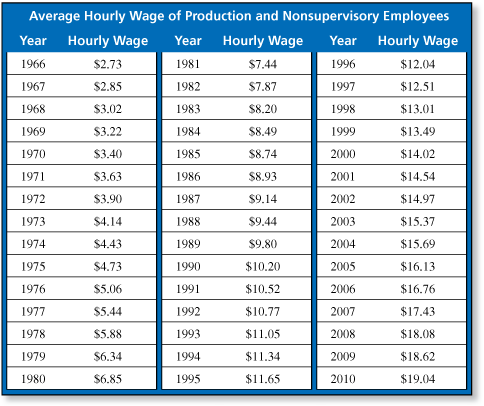
The table shows the average hourly wage of production and nonsupervisory employees in private industries across the United States from 1966 to 2010. Graph the average hourly wage of production and nonsupervisory employees from 1966 through 2010. Use the graph to describe the average hourly wage during these years. (See Example 5 and Example 6.)

-
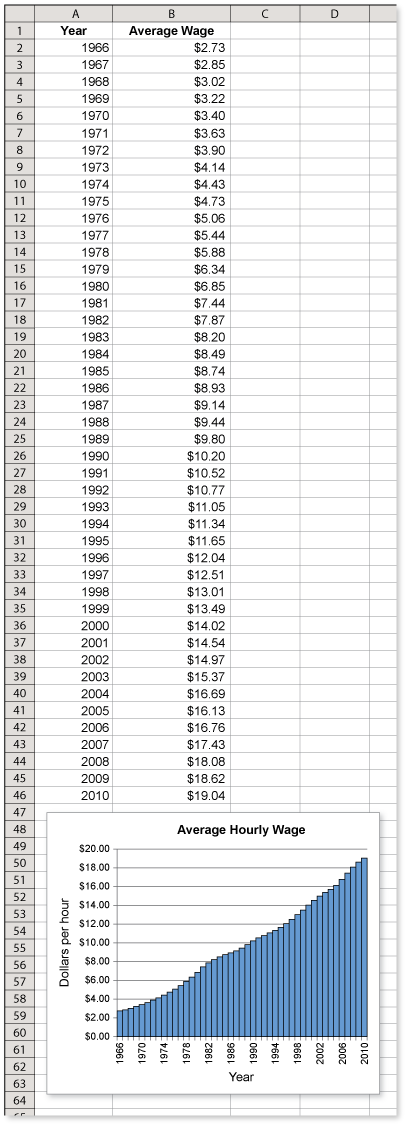
Enter the data into a spreadsheet. Then use the spreadsheet to draw the graph. From the graph you can see the following pattern.
1966-1984:
1984-1998:
1998-2010:
Exponential growth pattern (averaged 6.5% per year increase)
Linear growth pattern (averged $0.32 per year increase)
Steeper linear growth pattern (averaged $0.50 per year increase)
Comments (0)These comments are not screened before publication. Constructive debate about the information on this page is welcome, but personal attacks are not. Please do not post comments that are commercial in nature or that violate copyright. Comments that we regard as obscene, defamatory, or intended to incite violence will be removed. If you find a comment offensive, you may flag it.
When posting a comment, you agree to our Terms of Use.Showing 0 commentsSubscribe by email Subscribe by RSSThere are no comments. -
-
Compare your graph from Exercise 13 to the graph of the consumer price index on page 164. Do you think the average hourly wage of production and nonsupervisory employees depends on the CPI? Explain your reasoning. (See Example 5 and Example 6.)
These comments are not screened before publication. Constructive debate about the information on this page is welcome, but personal attacks are not. Please do not post comments that are commercial in nature or that violate copyright. Comments that we regard as obscene, defamatory, or intended to incite violence will be removed. If you find a comment offensive, you may flag it.
When posting a comment, you agree to our Terms of Use. -
The table shows the average hourly wage of production and nonsupervisory employees in private industries across the United States from 1966 to 2010. Did the average hourly wage of production and nonsupervisory employees have more buying power in 1990 than in 1970? Explain your reasoning. (See Example 5 and Example 6.)
-
Begin by making a table that compares the consumer price index with the average wage.
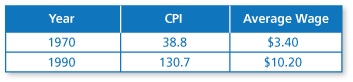
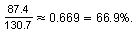
From 1970 to 1990, the CPI had a percent increase of
From 1970 to 1990, the average wage had a percent increase of
So, the average wage did not keep up with inflation.
These comments are not screened before publication. Constructive debate about the information on this page is welcome, but personal attacks are not. Please do not post comments that are commercial in nature or that violate copyright. Comments that we regard as obscene, defamatory, or intended to incite violence will be removed. If you find a comment offensive, you may flag it.
When posting a comment, you agree to our Terms of Use. -
-
The table shows the average hourly wage of production and nonsupervisory employees in private industries across the United States from 1966 to 2010. Did the average hourly wage of production and nonsupervisory employees have more buying power in 2010 than in 1990? Explain your reasoning. (See Example 5 and Example 6.)
These comments are not screened before publication. Constructive debate about the information on this page is welcome, but personal attacks are not. Please do not post comments that are commercial in nature or that violate copyright. Comments that we regard as obscene, defamatory, or intended to incite violence will be removed. If you find a comment offensive, you may flag it.
When posting a comment, you agree to our Terms of Use. -
Would you be better off financially to earn $50,000 in 1990 or $75,000 in 2010? Explain your reasoning. (See Example 5 and Example 6.)
-
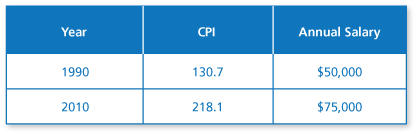
Begin by making a table that compares the consumer price index with your annual salary.
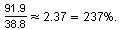
From 1990 to 2010, the CPI had a percent increase of
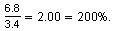
From 1990 to 2010, your salary had a percent increase of

So, your salary did not keep up with inflation. All else being equal, you were better off financially in 1990.
These comments are not screened before publication. Constructive debate about the information on this page is welcome, but personal attacks are not. Please do not post comments that are commercial in nature or that violate copyright. Comments that we regard as obscene, defamatory, or intended to incite violence will be removed. If you find a comment offensive, you may flag it.
When posting a comment, you agree to our Terms of Use. -
-
There is a discrepancy in buying power between the federal minimum hourly wage and the average hourly wage of production and nonsupervisory employees. Since 1978, do you think this discrepancy has increased, decreased or remained unchanged? Explain your reasoning. (See Example 5 and Example 6.)
These comments are not screened before publication. Constructive debate about the information on this page is welcome, but personal attacks are not. Please do not post comments that are commercial in nature or that violate copyright. Comments that we regard as obscene, defamatory, or intended to incite violence will be removed. If you find a comment offensive, you may flag it.
When posting a comment, you agree to our Terms of Use.