


-
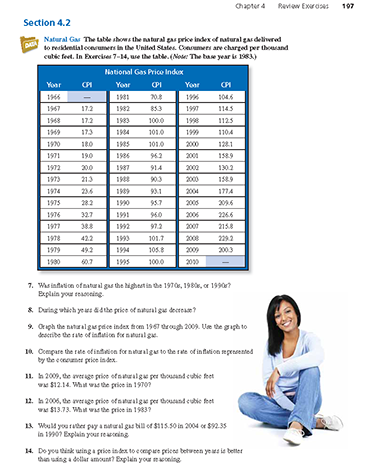
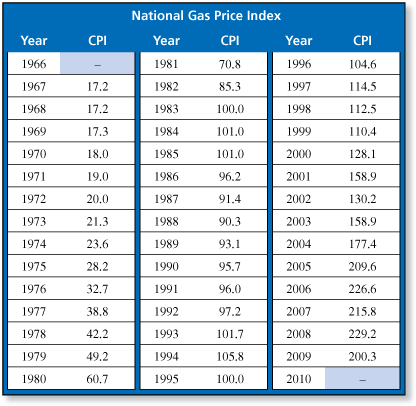
The table shows the natural gas price index of natural gas delivered to residential consumers in the United States. Consumers are charged per thousand cubic feet. (Note: The base year is 1983.) Was inflation of natural gas the highest in the 1970s, 1980s, or 1990s? Explain your reasoning.

-
One way to answer this question is to use a spreasheet to graph the data.
In the 1970s, the CPI for natural gas increased about 50 units. In the 1980s and 1990s, it increased less than that. So, inflation of natural gas was highest in the 1970s.
Comments (0)These comments are not screened before publication. Constructive debate about the information on this page is welcome, but personal attacks are not. Please do not post comments that are commercial in nature or that violate copyright. Comments that we regard as obscene, defamatory, or intended to incite violence will be removed. If you find a comment offensive, you may flag it.
When posting a comment, you agree to our Terms of Use.Showing 0 commentsSubscribe by email Subscribe by RSSThere are no comments. -
-
The table shows the natural gas price index of natural gas delivered to residential consumers in the United States. Consumers are charged per thousand cubic feet. (Note: The base year is 1983.) During which years did the price of natural gas decrease?
These comments are not screened before publication. Constructive debate about the information on this page is welcome, but personal attacks are not. Please do not post comments that are commercial in nature or that violate copyright. Comments that we regard as obscene, defamatory, or intended to incite violence will be removed. If you find a comment offensive, you may flag it.
When posting a comment, you agree to our Terms of Use. -
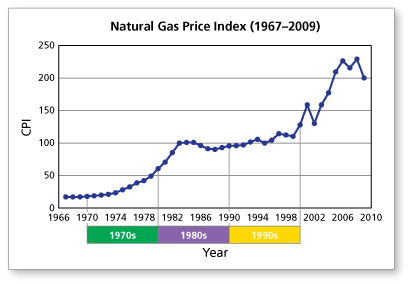
The table shows the natural gas price index of natural gas delivered to residential consumers in the United States. Consumers are charged per thousand cubic feet. (Note: The base year is 1983.) Graph the natural gas price index from 1967 through 2009. Use the graph to describe the rate of inflation for natural gas.
-
An easy way to graph the data is to use a spreadsheet.
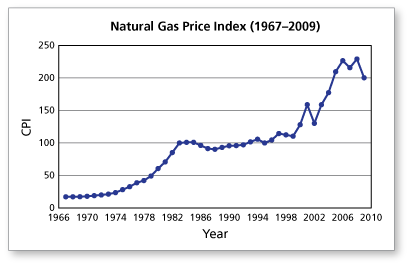
The price of natural gas has been through 3 periods of growth.
(a) From 1967 to 1983, the price was increasing each year.
(b) From 1983 to 1999, the price was relatively constant.
(c) From 1999 to 2006, the price was increasing each year.
These comments are not screened before publication. Constructive debate about the information on this page is welcome, but personal attacks are not. Please do not post comments that are commercial in nature or that violate copyright. Comments that we regard as obscene, defamatory, or intended to incite violence will be removed. If you find a comment offensive, you may flag it.
When posting a comment, you agree to our Terms of Use. -
-
The table shows the natural gas price index of natural gas delivered to residential consumers in the United States. Consumers are charged per thousand cubic feet. (Note: The base year is 1983.) Compare the rate of inflation for natural gas to the rate of inflation represented by the consumer price index.
These comments are not screened before publication. Constructive debate about the information on this page is welcome, but personal attacks are not. Please do not post comments that are commercial in nature or that violate copyright. Comments that we regard as obscene, defamatory, or intended to incite violence will be removed. If you find a comment offensive, you may flag it.
When posting a comment, you agree to our Terms of Use. -
The table shows the natural gas price index of natural gas delivered to residential consumers in the United States. Consumers are charged per thousand cubic feet. (Note: The base year is 1983.) In 2009, the average price of natural gas per thousand cubic feet was $12.14. What was the price in 1970?
-
Use the formula from Section 4.2.
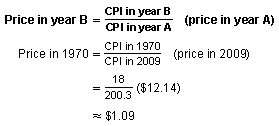
So, the price of natural gas in 1970 was about $1.09 per 1000 cubic feet.
These comments are not screened before publication. Constructive debate about the information on this page is welcome, but personal attacks are not. Please do not post comments that are commercial in nature or that violate copyright. Comments that we regard as obscene, defamatory, or intended to incite violence will be removed. If you find a comment offensive, you may flag it.
When posting a comment, you agree to our Terms of Use. -
-
The table shows the natural gas price index of natural gas delivered to residential consumers in the United States. Consumers are charged per thousand cubic feet. (Note: The base year is 1983.) In 2006, the average price of natural gas per thousand cubic feet was $13.73. What was the price in 1983?
These comments are not screened before publication. Constructive debate about the information on this page is welcome, but personal attacks are not. Please do not post comments that are commercial in nature or that violate copyright. Comments that we regard as obscene, defamatory, or intended to incite violence will be removed. If you find a comment offensive, you may flag it.
When posting a comment, you agree to our Terms of Use. -
Would you rather pay a natural gas bill of $115.50 in 2004 or $92.35 in 1990? Explain your reasoning.
-
Begin by making a table that compares the Consumer Price Index with your natural gas bill. (Note: Use the regular Consumer Price Index, not the CPI for Natural Gas.)
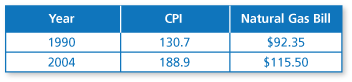
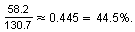
From 1990 to 2004, the CPI had a percent increase of
From 1990 to 2004, your natural gas bill had a percent increase of

So, your natural gas bill increased by a smaller percent than the general rate of inflation.
This means that you would be better paying a bill of $115.50 in 2004 than a bill of $92.35 in 1990.
These comments are not screened before publication. Constructive debate about the information on this page is welcome, but personal attacks are not. Please do not post comments that are commercial in nature or that violate copyright. Comments that we regard as obscene, defamatory, or intended to incite violence will be removed. If you find a comment offensive, you may flag it.
When posting a comment, you agree to our Terms of Use. -
-
Do you think using a price index to compare prices between years is better than using a dollar amount? Explain your reasoning.
These comments are not screened before publication. Constructive debate about the information on this page is welcome, but personal attacks are not. Please do not post comments that are commercial in nature or that violate copyright. Comments that we regard as obscene, defamatory, or intended to incite violence will be removed. If you find a comment offensive, you may flag it.
When posting a comment, you agree to our Terms of Use.