


Chapter 10 Review Exercises
-
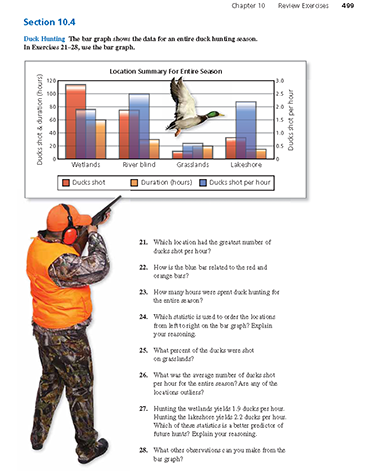
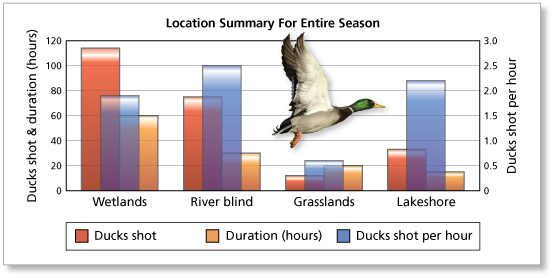
The bar graph shows the data for an entire duck hunting season. Which location had the greatest number of ducks shot per hour?
-
The location that had the greatest number of ducks shot per hour was the river blind because it has the highest blue bar.
Comments (0)These comments are not screened before publication. Constructive debate about the information on this page is welcome, but personal attacks are not. Please do not post comments that are commercial in nature or that violate copyright. Comments that we regard as obscene, defamatory, or intended to incite violence will be removed. If you find a comment offensive, you may flag it.
When posting a comment, you agree to our Terms of Use.Showing 0 commentsSubscribe by email Subscribe by RSSThere are no comments. -
-
The bar graph shows the data for an entire duck hunting season. How is the blue bar related to the red and orange bars?
These comments are not screened before publication. Constructive debate about the information on this page is welcome, but personal attacks are not. Please do not post comments that are commercial in nature or that violate copyright. Comments that we regard as obscene, defamatory, or intended to incite violence will be removed. If you find a comment offensive, you may flag it.
When posting a comment, you agree to our Terms of Use. -
The bar graph shows the data for an entire duck hunting season. How many hours were spent duck hunting for the entire season?
-
To estimate the total number of hours spent duck hunting for the entire season, estimate the values for all of the yellow bars and then add them.
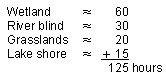
So, the total number of hours spent duck hunting for the entire season was about 125 hours.
These comments are not screened before publication. Constructive debate about the information on this page is welcome, but personal attacks are not. Please do not post comments that are commercial in nature or that violate copyright. Comments that we regard as obscene, defamatory, or intended to incite violence will be removed. If you find a comment offensive, you may flag it.
When posting a comment, you agree to our Terms of Use. -
-
The bar graph shows the data for an entire duck hunting season. Which statistic is used to order the locations from left to right on the bar graph? Explain your reasoning.
These comments are not screened before publication. Constructive debate about the information on this page is welcome, but personal attacks are not. Please do not post comments that are commercial in nature or that violate copyright. Comments that we regard as obscene, defamatory, or intended to incite violence will be removed. If you find a comment offensive, you may flag it.
When posting a comment, you agree to our Terms of Use. -
The bar graph shows the data for an entire duck hunting season. What percent of ducks were shot on grasslands?
-
To estimate the percent of ducks shot that were shot on grasslands, estimate the heights of all of the red bars and then add them. Then divide your estimate for the height of the red bar for grasslands by the sum of your estimates.
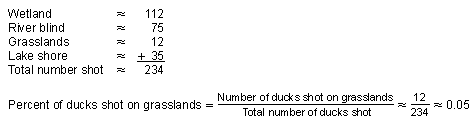
So, about 5% of the ducks were shot on grasslands.
These comments are not screened before publication. Constructive debate about the information on this page is welcome, but personal attacks are not. Please do not post comments that are commercial in nature or that violate copyright. Comments that we regard as obscene, defamatory, or intended to incite violence will be removed. If you find a comment offensive, you may flag it.
When posting a comment, you agree to our Terms of Use. -
-
The bar graph shows the data for an entire duck hunting season. What was the average number of ducks shot per hour for the entire season? Are any of the locations outliers?
These comments are not screened before publication. Constructive debate about the information on this page is welcome, but personal attacks are not. Please do not post comments that are commercial in nature or that violate copyright. Comments that we regard as obscene, defamatory, or intended to incite violence will be removed. If you find a comment offensive, you may flag it.
When posting a comment, you agree to our Terms of Use. -
The bar graph shows the data for an entire duck hunting season. Hunting the wetlands yields 1.9 ducks per hour. Hunting the lakeshore yields 2.2 ducks per hour. Which of these statistics is a better predictor of future hunts? Explain your reasoning.
-
The statistic that is a better predictor of future hunts is the 1.9 ducks per hour from the wetlands because it is based on more data. The hunting duration in the wetlands is 4 times the hunting duration on the lakeshore.
These comments are not screened before publication. Constructive debate about the information on this page is welcome, but personal attacks are not. Please do not post comments that are commercial in nature or that violate copyright. Comments that we regard as obscene, defamatory, or intended to incite violence will be removed. If you find a comment offensive, you may flag it.
When posting a comment, you agree to our Terms of Use. -
-
The bar graph shows the data for an entire duck hunting season. What other observations can you make from the bar graph?
These comments are not screened before publication. Constructive debate about the information on this page is welcome, but personal attacks are not. Please do not post comments that are commercial in nature or that violate copyright. Comments that we regard as obscene, defamatory, or intended to incite violence will be removed. If you find a comment offensive, you may flag it.
When posting a comment, you agree to our Terms of Use.