


-
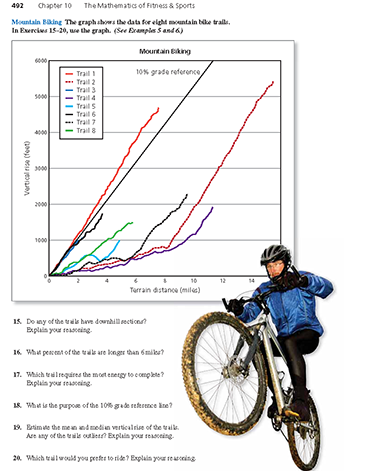
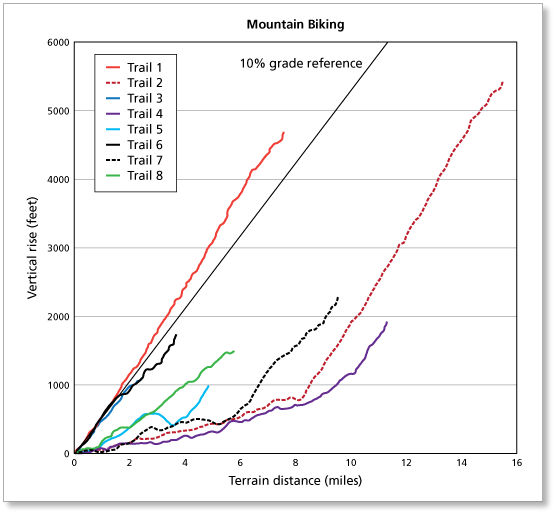
The graph shows the data for eight mountain bike trails. Do any of the trails have downhill sections? Explain your reasoning. (See Example 5 and Example 6.)
-
Yes, a line that decreases from left to right indicates a downhill section. For instance, Trail 5 has a downhill section between the 3-mile and 3.5-mile markers.
Comments (0)These comments are not screened before publication. Constructive debate about the information on this page is welcome, but personal attacks are not. Please do not post comments that are commercial in nature or that violate copyright. Comments that we regard as obscene, defamatory, or intended to incite violence will be removed. If you find a comment offensive, you may flag it.
When posting a comment, you agree to our Terms of Use.Showing 0 commentsSubscribe by email Subscribe by RSSThere are no comments. -
-
The graph shows the data for eight mountain bike trails. What percent of the trails are longer than 6 miles? (See Example 5 and Example 6.)
These comments are not screened before publication. Constructive debate about the information on this page is welcome, but personal attacks are not. Please do not post comments that are commercial in nature or that violate copyright. Comments that we regard as obscene, defamatory, or intended to incite violence will be removed. If you find a comment offensive, you may flag it.
When posting a comment, you agree to our Terms of Use. -
The graph shows the data for eight mountain bike trails. Which trail requires the most energy to complete? Explain your reasoning. (See Example 5 and Example 6.)
-
Trail 2 requires the most energy to complete because it is the longest trail and it has the steepest incline (after the 8-mile marker).
These comments are not screened before publication. Constructive debate about the information on this page is welcome, but personal attacks are not. Please do not post comments that are commercial in nature or that violate copyright. Comments that we regard as obscene, defamatory, or intended to incite violence will be removed. If you find a comment offensive, you may flag it.
When posting a comment, you agree to our Terms of Use. -
-
The graph shows the data for eight mountain bike trails. What is the purpose of the 10% grade reference line? (See Example 5 and Example 6.)
These comments are not screened before publication. Constructive debate about the information on this page is welcome, but personal attacks are not. Please do not post comments that are commercial in nature or that violate copyright. Comments that we regard as obscene, defamatory, or intended to incite violence will be removed. If you find a comment offensive, you may flag it.
When posting a comment, you agree to our Terms of Use. -
The graph shows the data for eight mountain bike trails. Estimate the mean and median vertical rises of the trails. Are any of the trails outliers? Explain your reasoning. (See Example 5 and Example 6.)
-
Using the graph, you can estimate the vertical rise of the trails by estimating the value on the vertical axis that corresponds to the end of each trail's line. The estimated vertical rise for each trail is shown in the box.
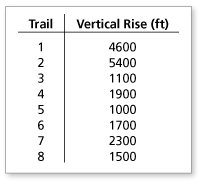
You can use your estimates to find the mean and the median. To find the mean, add the vertical rises and divide by the total number of vertical rises.

The mean is 2437.5 feet.
To find the median, order the data from least to greatest. Because there is an even number of vertical rises, you must add the two middle values and divide their sum by 2.
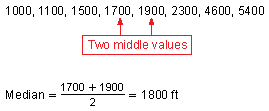
So, the median is 1800 feet.
Trail 1 and trail 2 are outliers. The vertical rise of both trails is a lot greater than the rest of the data.
These comments are not screened before publication. Constructive debate about the information on this page is welcome, but personal attacks are not. Please do not post comments that are commercial in nature or that violate copyright. Comments that we regard as obscene, defamatory, or intended to incite violence will be removed. If you find a comment offensive, you may flag it.
When posting a comment, you agree to our Terms of Use. -
-
The graph shows the data for eight mountain bike trails. Which trail would you prefer to ride? Explain your reasoning. (See Example 5 and Example 6.)
These comments are not screened before publication. Constructive debate about the information on this page is welcome, but personal attacks are not. Please do not post comments that are commercial in nature or that violate copyright. Comments that we regard as obscene, defamatory, or intended to incite violence will be removed. If you find a comment offensive, you may flag it.
When posting a comment, you agree to our Terms of Use.