


-
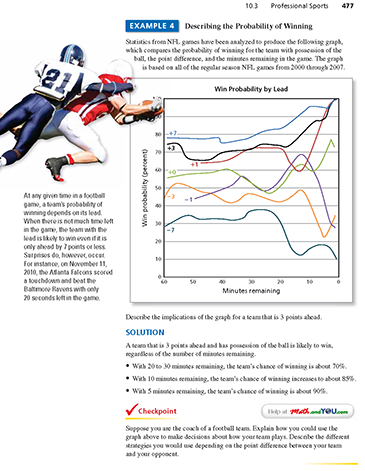
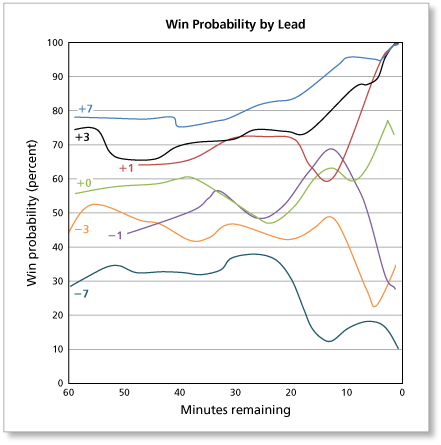
Here are some observations about the win probability graph on page 477 (also shown below).
- Remember that this graph is just for the team that has the ball.
- Here is what the lines represent.
• +7: The team with the ball is winning by 7 points. • +3: The team with the ball is winning by 3 points. • +1: The team with the ball is winning by 1 point. • -1: The team with the ball is losing by 1 point. • -3: The team with the ball is losing by 3 points. • -7: The team with the ball is losing by 7 point. - To find the win probability for the team without the ball, subtract the win probability of the team with the ball in the graph from 100%. Because the probability of winning for a team with the ball that is 3 points ahead with 10 minutes remaining is about 85%, the probability of winning for a team without the ball that is 3 points behind with 10 minutes remaining is about 100% - 85% = 15%.
- Notice that the graph drops off quickly for a team with the ball that is losing by 7 points with about 20 minutes remaining. There are similar drop offs for a team with the ball that is losing by 1 or 3 points with about 15 minutes to go.
- Notice that for any point in the game, the team with the ball and a lead has a greater than 50% chance of winning.
- Notice that from between 20 minutes remaining and 10 minutes remaining, the probability of a team with the ball winning while losing by 1 point is greater than the probability of a team with the ball winning while winning by 1 point. This seems contradictory to common sense because you would expect the probability while winning to be greater than the probability while losing. One factor that may influence this is that some teams play too conservatively with a small lead and play more aggressive when they are losing.
-
To watch video clips of exciting NFL football games, visit NFL.com. Here you can search by NFL team, season, and other criteria to find game clips of your favorite team.
-
Sample answer:
You could use the graph to make decisions such as whether to go for a 4th down and whether to kick a field goal or go for a touchdown depending on the stage of the game. The graph could also help you determine whether to play aggressively or conservatively depending on where you stand and how late it is in the game. For instance, if you lead by 1 point, you do not want to play too conservatively with 10-15 minutes remaining because the win probability graph shows a slight dip during that time. On the other hand, if you are down by 1 near the beginning of the 4th quarter, you should adopt an aggressive strategy and try to take the lead. If you are down by 7, you want to take the lead before the 20-minute mark (close to the end of the 3rd quarter) because there is a dramatic drop-off in win probability. If you are down by 1 or 3, the same applies for a few minutes into the 4th quarter.
-
Comments (0)
These comments are not screened before publication. Constructive debate about the information on this page is welcome, but personal attacks are not. Please do not post comments that are commercial in nature or that violate copyright. Comments that we regard as obscene, defamatory, or intended to incite violence will be removed. If you find a comment offensive, you may flag it.
When posting a comment, you agree to our Terms of Use.Showing 0 commentsSubscribe by email Subscribe by RSSThere are no comments.