


-
-
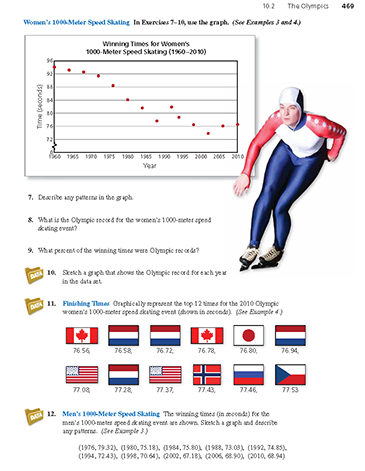
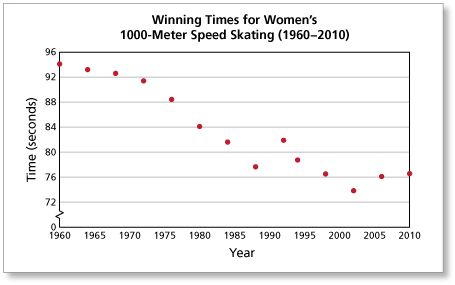
The winning time decreased every Olympics from 1960 through 1988. In 1992, it increased and then it decreased through 2002. Since 2002, it has increased at each Olympics.
Comments (0)These comments are not screened before publication. Constructive debate about the information on this page is welcome, but personal attacks are not. Please do not post comments that are commercial in nature or that violate copyright. Comments that we regard as obscene, defamatory, or intended to incite violence will be removed. If you find a comment offensive, you may flag it.
When posting a comment, you agree to our Terms of Use.Showing 0 commentsSubscribe by email Subscribe by RSSThere are no comments. -
-
What is the Olympic record for the women's 1000-meter speed skating event? (See Example 3 and Example 4.)
These comments are not screened before publication. Constructive debate about the information on this page is welcome, but personal attacks are not. Please do not post comments that are commercial in nature or that violate copyright. Comments that we regard as obscene, defamatory, or intended to incite violence will be removed. If you find a comment offensive, you may flag it.
When posting a comment, you agree to our Terms of Use. -
-
There are 14 points in the graph. A point represents an Olympic record if no point to its left lies lower on the vertical axis. Count the number of points that represent Olympic records.
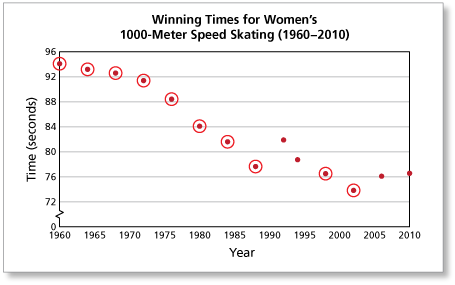
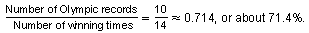
Of the 14 times, 10 were Olympic records. So, the percent of winning times that were Olympic records is
These comments are not screened before publication. Constructive debate about the information on this page is welcome, but personal attacks are not. Please do not post comments that are commercial in nature or that violate copyright. Comments that we regard as obscene, defamatory, or intended to incite violence will be removed. If you find a comment offensive, you may flag it.
When posting a comment, you agree to our Terms of Use. -
-
Sketch a graph that shows the Olympic record for each year in the data set. (See Example 3 and Example 4.)

These comments are not screened before publication. Constructive debate about the information on this page is welcome, but personal attacks are not. Please do not post comments that are commercial in nature or that violate copyright. Comments that we regard as obscene, defamatory, or intended to incite violence will be removed. If you find a comment offensive, you may flag it.
When posting a comment, you agree to our Terms of Use. -
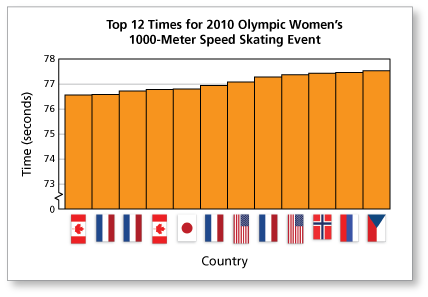
Graphically represent the top 12 times for the 2010 Olympic women's 1000-meter speed skating event (shown in seconds). (See Example 4.)

-
You can use a spreadsheet to make a bar graph of the top 12 times in the women's 1000-meter speed skating event at the 2010 Olympics.
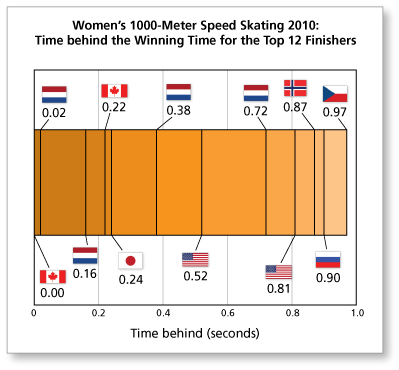
Another way to represent the data is by showing each speed skater in terms of time behind the winner. The stacked bar graph below illustrates the closeness of the top 12 times. Notice that all 12 speed skaters were within one second of winning.
These comments are not screened before publication. Constructive debate about the information on this page is welcome, but personal attacks are not. Please do not post comments that are commercial in nature or that violate copyright. Comments that we regard as obscene, defamatory, or intended to incite violence will be removed. If you find a comment offensive, you may flag it.
When posting a comment, you agree to our Terms of Use. -
-
The winning times (in seconds) for the men's 1000-meter speed skating event are shown. Sketch a graph and describe any patterns. (See Example 3.)
(1976, 79.32), (1980, 75.18), (1984, 75.80), (1988, 73.03), (1992, 74.85),
(1994, 72.43), (1998, 70.64), (2002, 67.18), (2006, 68.90), (2010, 68.94)
These comments are not screened before publication. Constructive debate about the information on this page is welcome, but personal attacks are not. Please do not post comments that are commercial in nature or that violate copyright. Comments that we regard as obscene, defamatory, or intended to incite violence will be removed. If you find a comment offensive, you may flag it.
When posting a comment, you agree to our Terms of Use.
