


-
Graphically represent the statement. (See Example 5.)
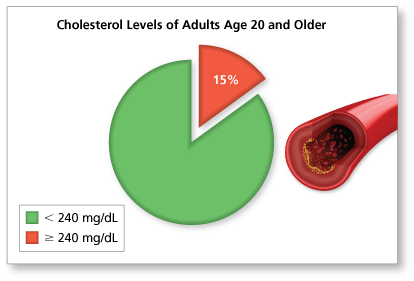
About 15% of adults 20 years and older have total cholesterol greater than or equal to 240 milligrams per deciliter.
-
A circle graph is a good choice to represent a part of a whole.
These comments are not screened before publication. Constructive debate about the information on this page is welcome, but personal attacks are not. Please do not post comments that are commercial in nature or that violate copyright. Comments that we regard as obscene, defamatory, or intended to incite violence will be removed. If you find a comment offensive, you may flag it.
When posting a comment, you agree to our Terms of Use. -
-
Graphically represent the statement. (See Example 5.)
About 13% of males 20 years old and older and 16% of females 20 years old and older have total cholesterol greater than or equal to 240 milligrams per deciliter.
These comments are not screened before publication. Constructive debate about the information on this page is welcome, but personal attacks are not. Please do not post comments that are commercial in nature or that violate copyright. Comments that we regard as obscene, defamatory, or intended to incite violence will be removed. If you find a comment offensive, you may flag it.
When posting a comment, you agree to our Terms of Use. -
Graphically represent the statement. (See Example 5.)
The average total cholesterol of adults 20 years and older is 198 milligrams per deciliter.
-
A number line is a good choice to represent a value that is part of a continuous spectrum.

These comments are not screened before publication. Constructive debate about the information on this page is welcome, but personal attacks are not. Please do not post comments that are commercial in nature or that violate copyright. Comments that we regard as obscene, defamatory, or intended to incite violence will be removed. If you find a comment offensive, you may flag it.
When posting a comment, you agree to our Terms of Use. -
-
Graphically represent the statement. (See Example 5.)
The average total cholesterol of males 20 years old and older is 195 milligrams per deciliter, and the average total cholesterol of females 20 years old and older is 200 milligrams per deciliter.
These comments are not screened before publication. Constructive debate about the information on this page is welcome, but personal attacks are not. Please do not post comments that are commercial in nature or that violate copyright. Comments that we regard as obscene, defamatory, or intended to incite violence will be removed. If you find a comment offensive, you may flag it.
When posting a comment, you agree to our Terms of Use. -
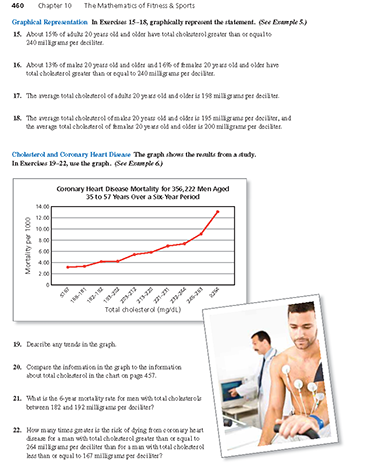
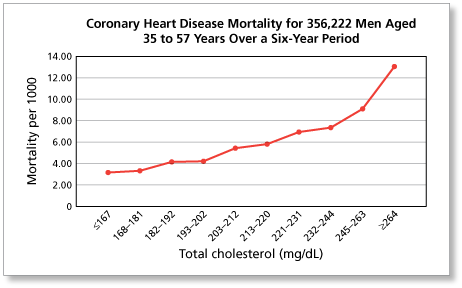
Describe any trends in the graph. (See Example 6.)
-
The most important trend that you should notice is that as total cholesterol rises, mortality from coronary heart disease rises.
These comments are not screened before publication. Constructive debate about the information on this page is welcome, but personal attacks are not. Please do not post comments that are commercial in nature or that violate copyright. Comments that we regard as obscene, defamatory, or intended to incite violence will be removed. If you find a comment offensive, you may flag it.
When posting a comment, you agree to our Terms of Use. -
-
Compare the information in the graph to the information about total cholesterol in the chart on page 457. (See Example 6.)

These comments are not screened before publication. Constructive debate about the information on this page is welcome, but personal attacks are not. Please do not post comments that are commercial in nature or that violate copyright. Comments that we regard as obscene, defamatory, or intended to incite violence will be removed. If you find a comment offensive, you may flag it.
When posting a comment, you agree to our Terms of Use. -
Use the information in the graph to determine the 6-year mortality rate for men with total cholesterols between 182 and 192 milligrams per deciliter. (See Example 6.)
-
From the graph, you can see that the 6-year mortality rate for men with total cholesterols between 182 and 192 milligrams per deciliter is about 4 men per 1000.
These comments are not screened before publication. Constructive debate about the information on this page is welcome, but personal attacks are not. Please do not post comments that are commercial in nature or that violate copyright. Comments that we regard as obscene, defamatory, or intended to incite violence will be removed. If you find a comment offensive, you may flag it.
When posting a comment, you agree to our Terms of Use. -
-
How many times greater is the risk of dying from coronary heart disease for a man with total cholesterol greater than or equal to 264 milligrams per deciliter than for a man with total cholesterol less than or equal to 167 milligrams per deciliter? (See Example 6.)
These comments are not screened before publication. Constructive debate about the information on this page is welcome, but personal attacks are not. Please do not post comments that are commercial in nature or that violate copyright. Comments that we regard as obscene, defamatory, or intended to incite violence will be removed. If you find a comment offensive, you may flag it.
When posting a comment, you agree to our Terms of Use.
Get iphone X all
[url]http://www.fatamamobile.tk
Great post thank
Keep doing good job
Eva miss
babybrae67@gmail.com