


-
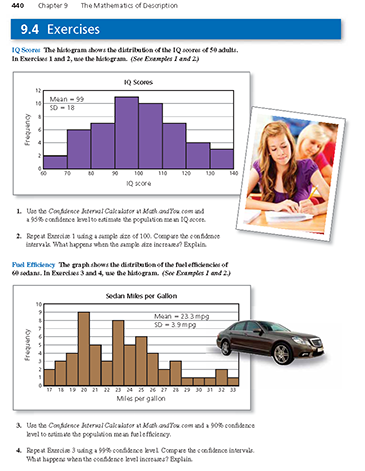
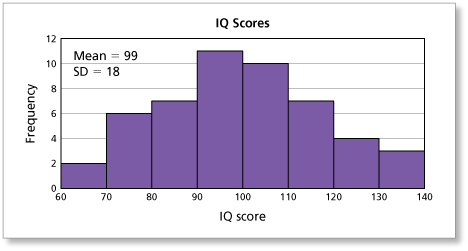
The histogram shows the distribution of the IQ scores of 50 adults. Use the Confidence Interval Calculator and a 95% confidence level to estimate the population mean IQ score. (See Example 1 and Example 2.)
-
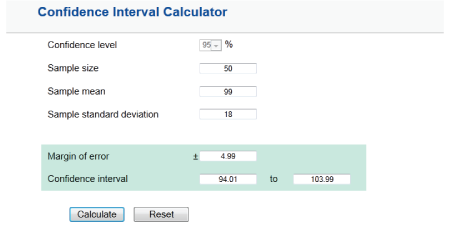
Using the Confidence Interval Calculator located in Tools, you can obtain the following.
Comments (0)These comments are not screened before publication. Constructive debate about the information on this page is welcome, but personal attacks are not. Please do not post comments that are commercial in nature or that violate copyright. Comments that we regard as obscene, defamatory, or intended to incite violence will be removed. If you find a comment offensive, you may flag it.
When posting a comment, you agree to our Terms of Use.Showing 0 commentsSubscribe by email Subscribe by RSSThere are no comments. -
-
The histogram shows the distribution of the IQ scores of 50 adults. Repeat Exercise 1 using a sample size of 100 and a 95% confidence level. Use the Confidence Interval Calculator to estimate the population mean IQ score. Compare this confidence interval to the confidence interval from Exercise 1. What happens when the sample size increases? Explain. (See Example 1 and Example 2.)
These comments are not screened before publication. Constructive debate about the information on this page is welcome, but personal attacks are not. Please do not post comments that are commercial in nature or that violate copyright. Comments that we regard as obscene, defamatory, or intended to incite violence will be removed. If you find a comment offensive, you may flag it.
When posting a comment, you agree to our Terms of Use. -
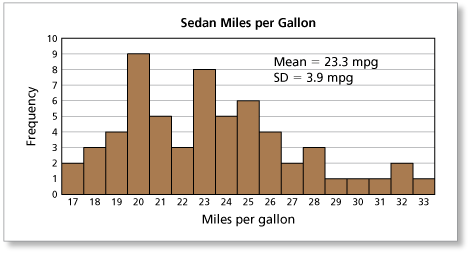
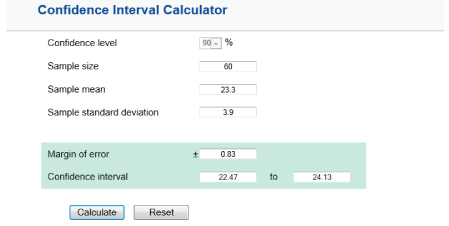
The histogram shows the distribution of the fuel efficiencies of 60 sedans. Use the Confidence Interval Calculator and a 90% confidence level to estimate the population mean fuel efficiency. (See Example 1 and Example 2.)
-
Using the Confidence Interval Calculator located in Tools, you can obtain the following.
- 90% Confidence Level: The population mean is 23.3 ± 0.83.
These comments are not screened before publication. Constructive debate about the information on this page is welcome, but personal attacks are not. Please do not post comments that are commercial in nature or that violate copyright. Comments that we regard as obscene, defamatory, or intended to incite violence will be removed. If you find a comment offensive, you may flag it.
When posting a comment, you agree to our Terms of Use. -
-
The histogram shows the distribution of the fuel efficiencies of 60 sedans. Repeat Exercise 3 using a 99% confidence level. Use the Confidence Interval Calculator to estimate the population mean fuel efficiency. Compare this confidence interval to the confidence interval from Exercise 3. What happens when the confidence level increases? Explain. (See Example 1 and Example 2.)
These comments are not screened before publication. Constructive debate about the information on this page is welcome, but personal attacks are not. Please do not post comments that are commercial in nature or that violate copyright. Comments that we regard as obscene, defamatory, or intended to incite violence will be removed. If you find a comment offensive, you may flag it.
When posting a comment, you agree to our Terms of Use.