


-
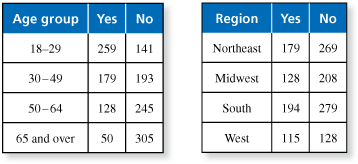
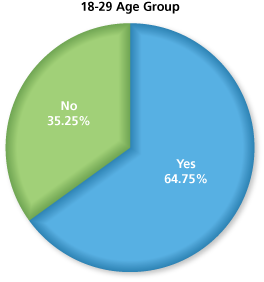
The tables show the results of a survey that asked whether the Internet is a main news source. Find the probability that a person in the 18-29 age group says "yes." (See Example 3 and Example 4.)
-
In the 18-29 age group, there are 259 + 141 = 400 people. Of these, 259 responded with "yes" in the survey. So, based on this sample, the probability that a randomly chosen person in this age group would say "yes" is

Comments (0)These comments are not screened before publication. Constructive debate about the information on this page is welcome, but personal attacks are not. Please do not post comments that are commercial in nature or that violate copyright. Comments that we regard as obscene, defamatory, or intended to incite violence will be removed. If you find a comment offensive, you may flag it.
When posting a comment, you agree to our Terms of Use.Showing 0 commentsSubscribe by email Subscribe by RSSThere are no comments. -
-
The tables show the results of a survey that asked whether the Internet is a main news source. Find the probability that a person in the 65 and over age group says "yes." (See Example 3 and Example 4.)
These comments are not screened before publication. Constructive debate about the information on this page is welcome, but personal attacks are not. Please do not post comments that are commercial in nature or that violate copyright. Comments that we regard as obscene, defamatory, or intended to incite violence will be removed. If you find a comment offensive, you may flag it.
When posting a comment, you agree to our Terms of Use. -
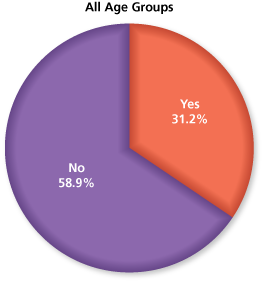
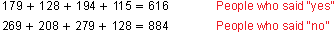
The tables show the results of a survey that asked whether the Internet is a main news source. Find the probability that a person in any age group says "no." (See Example 3 and Example 4.)
-
Using the age group table, add the data in the "Yes" and "No" columns.
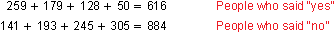
Based on this sample, the probability that a randomly chosen person would say "no" is

These comments are not screened before publication. Constructive debate about the information on this page is welcome, but personal attacks are not. Please do not post comments that are commercial in nature or that violate copyright. Comments that we regard as obscene, defamatory, or intended to incite violence will be removed. If you find a comment offensive, you may flag it.
When posting a comment, you agree to our Terms of Use. -
-
The tables show the results of a survey that asked whether the Internet is a main news source. Find the probability that a person in any region says "no." (See Example 3 and Example 4.)
These comments are not screened before publication. Constructive debate about the information on this page is welcome, but personal attacks are not. Please do not post comments that are commercial in nature or that violate copyright. Comments that we regard as obscene, defamatory, or intended to incite violence will be removed. If you find a comment offensive, you may flag it.
When posting a comment, you agree to our Terms of Use. -
The tables show the results of a survey that asked whether the Internet is a main news source. Compare your answers to Exercises 11 and 12. What do you notice?
-
Age Groups: Using the age group table, add the data in the "Yes" and "No" columns.

Based on this sample, the probability that a randomly chosen person would say "no" is

Regions: Using the region table, add the data in the "Yes" and "No" columns.
Based on this sample, the probability that a randomly chosen person would say "no" is

So, you obain the same answer regardless of which table you use.
These comments are not screened before publication. Constructive debate about the information on this page is welcome, but personal attacks are not. Please do not post comments that are commercial in nature or that violate copyright. Comments that we regard as obscene, defamatory, or intended to incite violence will be removed. If you find a comment offensive, you may flag it.
When posting a comment, you agree to our Terms of Use. -
-
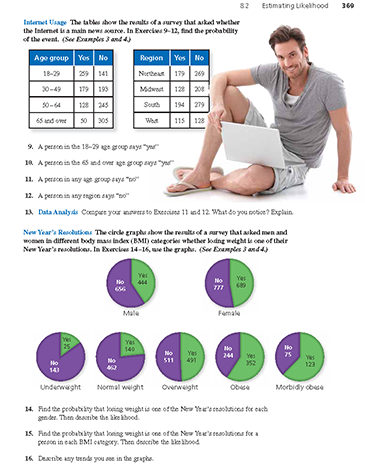
The graphs show the results of a survey that asked men and women in different body mass index (BMI) categories whether losing weight is one of their New Year's resolutions.
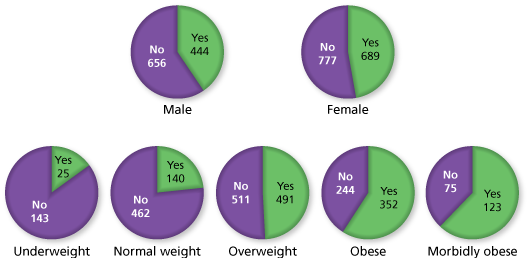
Find the probability that losing weight is one of the New Year's resolutions for each gender. Then describe the likelihood. (See Example 3 and Example 4.)
These comments are not screened before publication. Constructive debate about the information on this page is welcome, but personal attacks are not. Please do not post comments that are commercial in nature or that violate copyright. Comments that we regard as obscene, defamatory, or intended to incite violence will be removed. If you find a comment offensive, you may flag it.
When posting a comment, you agree to our Terms of Use. -
The graphs show the results of a survey that asked men and women in different body mass index (BMI) categories whether losing weight is one of their New Year's resolutions.
Find the probability that losing weight is one of the New Year's resolutions for a person in each BMI category. Then describe the likelihood. (See Example 3 and Example 4.)
-
Underweight: There are 25 + 143 = 168 underweight people in the survey. Of these, 25 said that losing weight is one of their New Year's resolutions. So, based on this survey, the probability that an underweight person chosen at random will say that losing weight is one of his or her New Year's resolutions is

Normal weight: There are 140 + 462 = 602 normal weight people in the survey. Of these, 140 said that losing weight is one of their New Year's resolutions. So, based on this survey, the probability that a normal weight person chosen at random will say that losing weight is one of his or her New Year's resolutions is

Overweight: There are 491 + 511 = 1002 overweight people in the survey. Of these, 491 said that losing weight is one of their New Year's resolutions. So, based on this survey, the probability that an overweight person chosen at random will say that losing weight is one of his or her New Year's resolutions is

Obese: There are 352 + 244 = 596 obese people in the survey. Of these, 352 said that losing weight is one of their New Year's resolutions. So, based on this survey, the probability that an obese person chosen at random will say that losing weight is one of his or her New Year's resolutions is

Morbidly obese: There are 123 + 75 = 198 morbidly obese people in the survey. Of these, 123 said that losing weight is one of their New Year's resolutions. So, based on this survey, the probability that a morbidly obese person chosen at random will say that losing weight is one of his or her New Year's resolutions is

These comments are not screened before publication. Constructive debate about the information on this page is welcome, but personal attacks are not. Please do not post comments that are commercial in nature or that violate copyright. Comments that we regard as obscene, defamatory, or intended to incite violence will be removed. If you find a comment offensive, you may flag it.
When posting a comment, you agree to our Terms of Use. -
-
The graphs show the results of a survey that asked men and women in different body mass index (BMI) categories whether losing weight is one of their New Year's resolutions.
Describe any trends you see in the graphs. (See Example 3 and Example 4.)
These comments are not screened before publication. Constructive debate about the information on this page is welcome, but personal attacks are not. Please do not post comments that are commercial in nature or that violate copyright. Comments that we regard as obscene, defamatory, or intended to incite violence will be removed. If you find a comment offensive, you may flag it.
When posting a comment, you agree to our Terms of Use.