


-
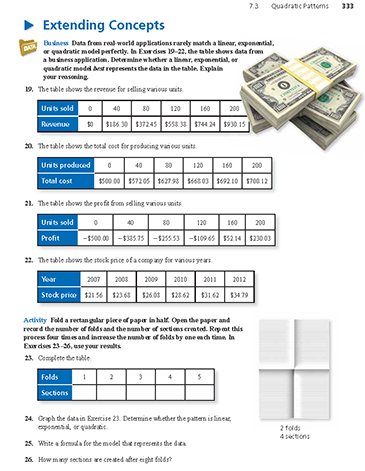
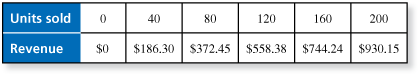
Data from real-world applications rarely match a linear, exponential, or quadratic model perfectly. The table shows the revenue for selling various units. Determine whether a linear, exponential, or quadratic model best represents the data in the table. Explain your reasoning.

-
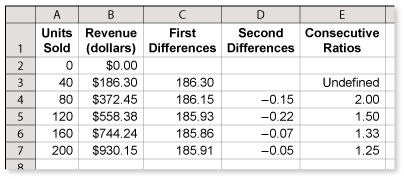
Use a spreadsheet to analyze the data. The first differences are about equal. So, a linear model best represents the data.
Comments (0)These comments are not screened before publication. Constructive debate about the information on this page is welcome, but personal attacks are not. Please do not post comments that are commercial in nature or that violate copyright. Comments that we regard as obscene, defamatory, or intended to incite violence will be removed. If you find a comment offensive, you may flag it.
When posting a comment, you agree to our Terms of Use.Showing 0 commentsSubscribe by email Subscribe by RSSThere are no comments. -
-
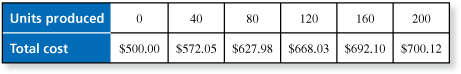
Data from real-world applications rarely match a linear, exponential, or quadratic model perfectly. The table shows the total cost for producing various units. Determine whether a linear, exponential, or quadratic model best represents the data in the table. Explain your reasoning.
These comments are not screened before publication. Constructive debate about the information on this page is welcome, but personal attacks are not. Please do not post comments that are commercial in nature or that violate copyright. Comments that we regard as obscene, defamatory, or intended to incite violence will be removed. If you find a comment offensive, you may flag it.
When posting a comment, you agree to our Terms of Use. -
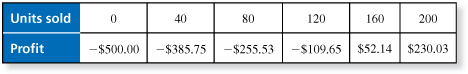
Data from real-world applications rarely match a linear, exponential, or quadratic model perfectly. The table shows the profit from selling various units. Determine whether a linear, exponential, or quadratic model best represents the data in the table. Explain your reasoning.
-
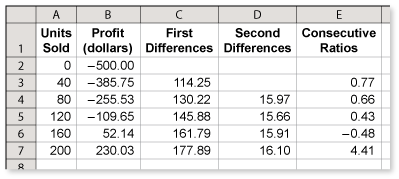
Use a spreadsheet to analyze the data. The second differences are about equal. So, a quadratic model best represents the data.
These comments are not screened before publication. Constructive debate about the information on this page is welcome, but personal attacks are not. Please do not post comments that are commercial in nature or that violate copyright. Comments that we regard as obscene, defamatory, or intended to incite violence will be removed. If you find a comment offensive, you may flag it.
When posting a comment, you agree to our Terms of Use. -
-
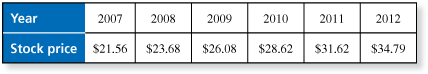
Data from real-world applications rarely match a linear, exponential, or quadratic model perfectly. The table shows the stock price of a company for various years. Determine whether a linear, exponential, or quadratic model best represents the data in the table. Explain your reasoning.
These comments are not screened before publication. Constructive debate about the information on this page is welcome, but personal attacks are not. Please do not post comments that are commercial in nature or that violate copyright. Comments that we regard as obscene, defamatory, or intended to incite violence will be removed. If you find a comment offensive, you may flag it.
When posting a comment, you agree to our Terms of Use. -
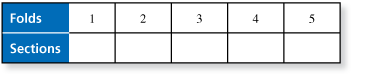
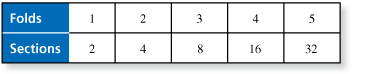
Fold a rectangular piece of paper in half. Open the paper and record the number of folds and the number of sections created. Repeat this process four times and increase the number of folds by one each time.

2 Folds
4 SectionsComplete the table.
-
The completed table is shown below.
These comments are not screened before publication. Constructive debate about the information on this page is welcome, but personal attacks are not. Please do not post comments that are commercial in nature or that violate copyright. Comments that we regard as obscene, defamatory, or intended to incite violence will be removed. If you find a comment offensive, you may flag it.
When posting a comment, you agree to our Terms of Use. -
-
Graph the data in Exercise 23. Determine whether the pattern is linear, exponential, or quadratic.
These comments are not screened before publication. Constructive debate about the information on this page is welcome, but personal attacks are not. Please do not post comments that are commercial in nature or that violate copyright. Comments that we regard as obscene, defamatory, or intended to incite violence will be removed. If you find a comment offensive, you may flag it.
When posting a comment, you agree to our Terms of Use. -
Fold a rectangular piece of paper in half. Open the paper and record the number of folds and the number of sections created. Repeat this process four times and increase the number of folds by one each time.
2 Folds
4 SectionsWrite a formula for the model that represents the data.
-
Each time the paper is folded, the number of sections doubles.
Let n be the number of folds. Let S be the number of sections.
A formula that relates n and S is

These comments are not screened before publication. Constructive debate about the information on this page is welcome, but personal attacks are not. Please do not post comments that are commercial in nature or that violate copyright. Comments that we regard as obscene, defamatory, or intended to incite violence will be removed. If you find a comment offensive, you may flag it.
When posting a comment, you agree to our Terms of Use. -
-
Fold a rectangular piece of paper in half. Open the paper and record the number of folds and the number of sections created. Repeat this process four times and increase the number of folds by one each time. How many sections are created after eight folds?
These comments are not screened before publication. Constructive debate about the information on this page is welcome, but personal attacks are not. Please do not post comments that are commercial in nature or that violate copyright. Comments that we regard as obscene, defamatory, or intended to incite violence will be removed. If you find a comment offensive, you may flag it.
When posting a comment, you agree to our Terms of Use.