


-
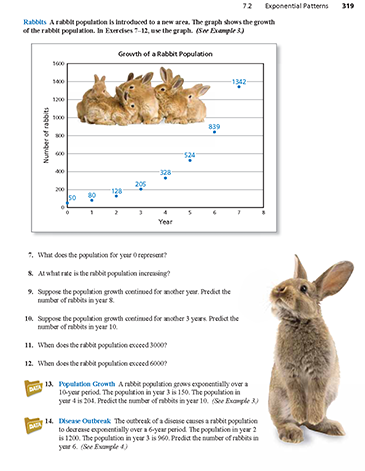
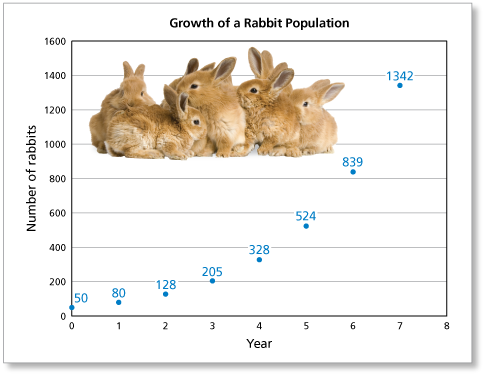
A rabbit population is introduced to a new area. The graph shows the growth of the rabbit population. What does the population for year 0 represent? (See Example 3.)
-
The population for the year 0 is 50. This means that 50 rabbits were introduced into the new area.
Comments (1)These comments are not screened before publication. Constructive debate about the information on this page is welcome, but personal attacks are not. Please do not post comments that are commercial in nature or that violate copyright. Comments that we regard as obscene, defamatory, or intended to incite violence will be removed. If you find a comment offensive, you may flag it.
When posting a comment, you agree to our Terms of Use.Showing 1 commentsSubscribe by email Subscribe by RSS Guest 4 years ago |where are the numbers?1 0
 -
-
A rabbit population is introduced to a new area. The graph shows the growth of the rabbit population. At what rate is the rabbit population increasing? (See Example 3.)
These comments are not screened before publication. Constructive debate about the information on this page is welcome, but personal attacks are not. Please do not post comments that are commercial in nature or that violate copyright. Comments that we regard as obscene, defamatory, or intended to incite violence will be removed. If you find a comment offensive, you may flag it.
When posting a comment, you agree to our Terms of Use. -
A rabbit population is introduced to a new area. The graph shows the growth of the rabbit population. Suppose the population growth continued for another 3 years. Predict the number of rabbits in year 8. (See Example 3.)
-
From the data given in the graph, you can see that each year the rabbit population is increasing by 60%.

If this pattern continues for another year, then the population would increase as follows.
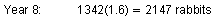
So, in year 8 there would be about 2150 rabbits.
These comments are not screened before publication. Constructive debate about the information on this page is welcome, but personal attacks are not. Please do not post comments that are commercial in nature or that violate copyright. Comments that we regard as obscene, defamatory, or intended to incite violence will be removed. If you find a comment offensive, you may flag it.
When posting a comment, you agree to our Terms of Use. -
-
A rabbit population is introduced to a new area. The graph shows the growth of the rabbit population. Suppose the population growth continued for another 3 years. Predict the number of rabbits in year 10. (See Example 3.)
These comments are not screened before publication. Constructive debate about the information on this page is welcome, but personal attacks are not. Please do not post comments that are commercial in nature or that violate copyright. Comments that we regard as obscene, defamatory, or intended to incite violence will be removed. If you find a comment offensive, you may flag it.
When posting a comment, you agree to our Terms of Use. -
A rabbit population is introduced to a new area. The graph shows the growth of the rabbit population. When does the rabbit population exceed 3000? (See Example 3.)
-
From the data given in the graph, you can see that each year the rabbit population is increasing by 60%.

If this pattern continues, then the population would increase as follows.
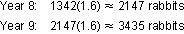
So, in year 9 the population would exceed 3000 rabbits.
These comments are not screened before publication. Constructive debate about the information on this page is welcome, but personal attacks are not. Please do not post comments that are commercial in nature or that violate copyright. Comments that we regard as obscene, defamatory, or intended to incite violence will be removed. If you find a comment offensive, you may flag it.
When posting a comment, you agree to our Terms of Use. -
-
A rabbit population is introduced to a new area. The graph shows the growth of the rabbit population. When does the rabbit population exceed 6000? (See Example 3.)
These comments are not screened before publication. Constructive debate about the information on this page is welcome, but personal attacks are not. Please do not post comments that are commercial in nature or that violate copyright. Comments that we regard as obscene, defamatory, or intended to incite violence will be removed. If you find a comment offensive, you may flag it.
When posting a comment, you agree to our Terms of Use. -
A rabbit population grows exponentially over a 10-year period. The population in year 3 is 150. The population in year 4 is 204. Predict the number of rabbits in year 10. (See Example 3.)

-
The percent change from year 3 to year 4 is

which is a 36% increase. You can use a spreadsheet to estimate the population in year 10.
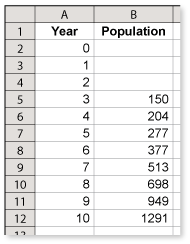
Notice that you don't have to know the population in the years 0, 1, 2, and 3 to answer the question.
These comments are not screened before publication. Constructive debate about the information on this page is welcome, but personal attacks are not. Please do not post comments that are commercial in nature or that violate copyright. Comments that we regard as obscene, defamatory, or intended to incite violence will be removed. If you find a comment offensive, you may flag it.
When posting a comment, you agree to our Terms of Use. -
-
The outbreak of a disease causes a rabbit population to decrease exponentially over a 6-year period. The population in year 2 is 1200. The population in year 3 is 960. Predict the number of rabbits in year 6. (See Example 4.)
These comments are not screened before publication. Constructive debate about the information on this page is welcome, but personal attacks are not. Please do not post comments that are commercial in nature or that violate copyright. Comments that we regard as obscene, defamatory, or intended to incite violence will be removed. If you find a comment offensive, you may flag it.
When posting a comment, you agree to our Terms of Use.