


-
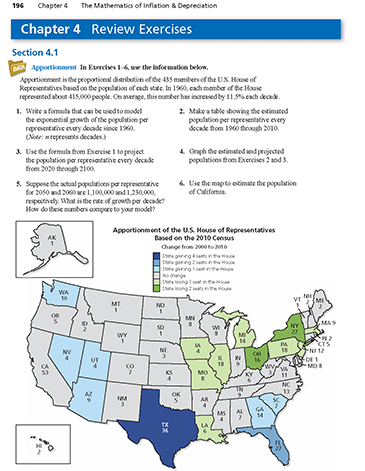
Apportionment is the proportional distribution of the 435 members of the U.S. House of Representatives based on the population of each state. In 1960, each member of the House represented about 415,000 people. On average, this number has increased by 11.5% each decade.
Write a formula that can be used to model the exponential growth of the population per representative every decade since 1960. (Note: n represents decades.)
-
The formula for this exponential growth is
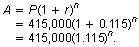
P = 415,000 people, r = 11.5%, n is the number of decades
Comments (0)These comments are not screened before publication. Constructive debate about the information on this page is welcome, but personal attacks are not. Please do not post comments that are commercial in nature or that violate copyright. Comments that we regard as obscene, defamatory, or intended to incite violence will be removed. If you find a comment offensive, you may flag it.
When posting a comment, you agree to our Terms of Use.Showing 0 commentsSubscribe by email Subscribe by RSSThere are no comments. -
-
Apportionment is the proportional distribution of the 435 members of the U.S. House of Representatives based on the population of each state. In 1960, each member of the House represented about 415,000 people. On average, this number has increased by 11.5% each decade. Make a table showing the estimated population per representative every decade from 1960 through 2010.
A spreadsheet is available to help you complete this exercise.
These comments are not screened before publication. Constructive debate about the information on this page is welcome, but personal attacks are not. Please do not post comments that are commercial in nature or that violate copyright. Comments that we regard as obscene, defamatory, or intended to incite violence will be removed. If you find a comment offensive, you may flag it.
When posting a comment, you agree to our Terms of Use. -
Apportionment is the proportional distribution of the 435 members of the U.S. House of Representatives based on the population of each state. In 1960, each member of the House represented about 415,000 people. On average, this number has increased by 11.5% each decade.
Use the formula from Exercise 1 to project the population per representative every decade from 2020 through 2100.
A spreadsheet is available to help you complete this exercise.
-
The formula for this exponential growth is
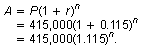
P = 415,000 people, r = 11.5%, n is the number of decades
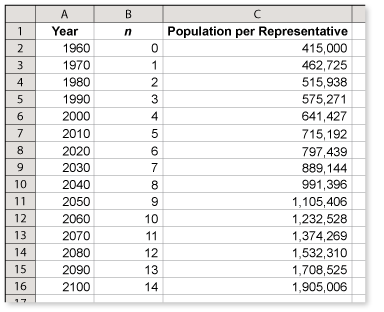
A spreadsheet using this formula is shown below.

These comments are not screened before publication. Constructive debate about the information on this page is welcome, but personal attacks are not. Please do not post comments that are commercial in nature or that violate copyright. Comments that we regard as obscene, defamatory, or intended to incite violence will be removed. If you find a comment offensive, you may flag it.
When posting a comment, you agree to our Terms of Use. -
-
Apportionment is the proportional distribution of the 435 members of the U.S. House of Representatives based on the population of each state. In 1960, each member of the House represented about 415,000 people. On average, this number has increased by 11.5% each decade. Graph the estimated and projected populations from Exercises 2 and 3.
A spreadsheet is available to help you complete this exercise.
These comments are not screened before publication. Constructive debate about the information on this page is welcome, but personal attacks are not. Please do not post comments that are commercial in nature or that violate copyright. Comments that we regard as obscene, defamatory, or intended to incite violence will be removed. If you find a comment offensive, you may flag it.
When posting a comment, you agree to our Terms of Use. -
Apportionment is the proportional distribution of the 435 members of the U.S. House of Representatives based the population of each state. In 1960, each member of the House represented about 415,000 people. On average, this number has increased by 11.5% each decade.
Suppose the actual populations per representative for 2050 and 2060 are 1,100,000 and 1,230,000, respectively. What is the rate of growth per decade? How do these numbers compare to your model?
A spreadsheet is available to help you complete this exercise.
-
If the actual population per representative increased from 1,100,000 to1,230,000 from 2050 to 2060, the rate of growth for this decade would be
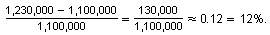
A spreadsheet using the formula from Exercise 1 is shown below. The actual populations per representative for 2050 and 2060 closely follow the values in the model.

These comments are not screened before publication. Constructive debate about the information on this page is welcome, but personal attacks are not. Please do not post comments that are commercial in nature or that violate copyright. Comments that we regard as obscene, defamatory, or intended to incite violence will be removed. If you find a comment offensive, you may flag it.
When posting a comment, you agree to our Terms of Use. -
-
Apportionment is the proportional distribution of the 435 members of the U.S. House of Representatives based on the population of each state. In 1960, each member of the House represented about 415,000 people. On average, this number has increased by 11.5% each decade. Use the map to estimate the population of California.

These comments are not screened before publication. Constructive debate about the information on this page is welcome, but personal attacks are not. Please do not post comments that are commercial in nature or that violate copyright. Comments that we regard as obscene, defamatory, or intended to incite violence will be removed. If you find a comment offensive, you may flag it.
When posting a comment, you agree to our Terms of Use.