


-
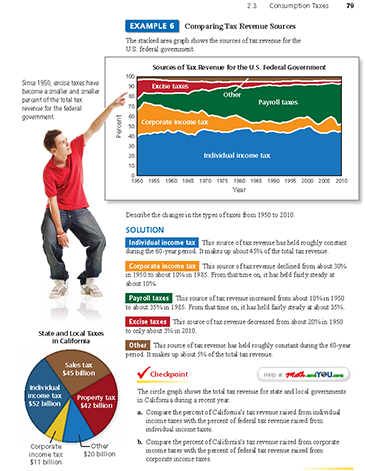
The graph in Example 6 is called a stacked area graph. It shows five sources of tax revenue for the federal government. From bottom to top:
- Individual income tax
- Corporate income tax
- Payroll tax
- Excise tax
- Other
To determine the percent of each tax, you need to estimate the height of its shaded area.
-
Have you ever wondered how the government spends our tax money? The largest areas of spending include:
- Defense and security
- Social security
- Medicare, Medicaid, and CHIP
If you'd like more information on government spending, visit the Center for Budget and Policy Priorities.
-
-
The total taxes represented by the circle graph are

The percent represented by individual income tax is
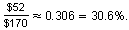
This is less than the percent for individual income taxes for the federal government.
-
The percent represented by corporate income tax is
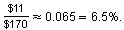
This is less than the percent for corporate income taxes for the federal government.
-
-
Comments (1)
These comments are not screened before publication. Constructive debate about the information on this page is welcome, but personal attacks are not. Please do not post comments that are commercial in nature or that violate copyright. Comments that we regard as obscene, defamatory, or intended to incite violence will be removed. If you find a comment offensive, you may flag it.
When posting a comment, you agree to our Terms of Use.Showing 1 commentsSubscribe by email Subscribe by RSS Ron Larson (author)1 decade ago |The graph in Example 6 is called a 100% stacked area graph. You can read more about this and other types of data displays in Section 9.1.2 0