


-
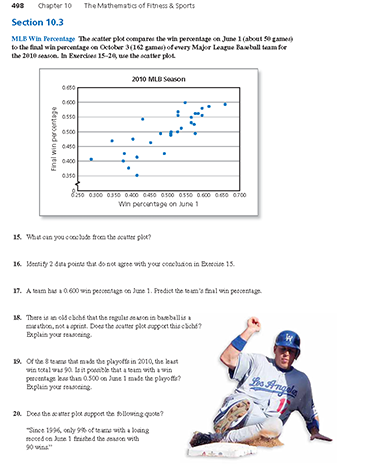
The scatter plot compares the win percentage on June 1 (about 50 games) to the final win percentage on October 3 (162 games) of every Major League Baseball team for the 2010 season. What can you conclude from the scatter plot?
-
From the graph, you can see that there is a positive correlation between win percentage on June 1 and final win percentage.
Comments (0)These comments are not screened before publication. Constructive debate about the information on this page is welcome, but personal attacks are not. Please do not post comments that are commercial in nature or that violate copyright. Comments that we regard as obscene, defamatory, or intended to incite violence will be removed. If you find a comment offensive, you may flag it.
When posting a comment, you agree to our Terms of Use.Showing 0 commentsSubscribe by email Subscribe by RSSThere are no comments. -
-
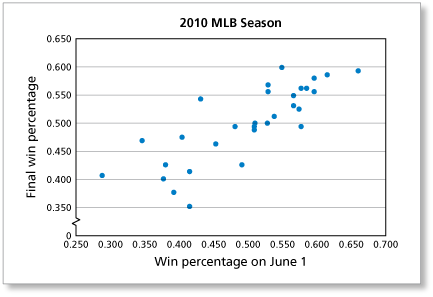
The scatter plot compares the win percentage on June 1 (about 50 games) to the final win percentage on October 3 (162 games) of every Major League Baseball team for the 2010 season. Identify 2 data points that do not agree with your conclusion in Exercise 15.
These comments are not screened before publication. Constructive debate about the information on this page is welcome, but personal attacks are not. Please do not post comments that are commercial in nature or that violate copyright. Comments that we regard as obscene, defamatory, or intended to incite violence will be removed. If you find a comment offensive, you may flag it.
When posting a comment, you agree to our Terms of Use. -
The scatter plot compares the win percentage on June 1 (about 50 games) to the final win percentage on October 3 (162 games) of every Major League Baseball team for the 2010 season. A team has a 0.600 win percentage on June 1. Predict the team's final win percentage.
-
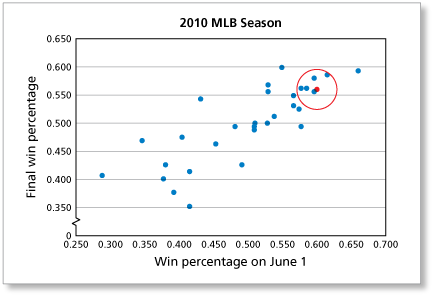
From the graph, you can predict that a team with a win percentage of 0.600 on June 1 will have a final win percentage between 0.550 and 0.600.
These comments are not screened before publication. Constructive debate about the information on this page is welcome, but personal attacks are not. Please do not post comments that are commercial in nature or that violate copyright. Comments that we regard as obscene, defamatory, or intended to incite violence will be removed. If you find a comment offensive, you may flag it.
When posting a comment, you agree to our Terms of Use. -
-
The scatter plot compares the win percentage on June 1 (about 50 games) to the final win percentage on October 3 (162 games) of every Major League Baseball team for the 2010 season. There is an old cliché that the regular season in baseball is a marathon, not a sprint. Does the scatter plot support this cliché? Explain your reasoning.
These comments are not screened before publication. Constructive debate about the information on this page is welcome, but personal attacks are not. Please do not post comments that are commercial in nature or that violate copyright. Comments that we regard as obscene, defamatory, or intended to incite violence will be removed. If you find a comment offensive, you may flag it.
When posting a comment, you agree to our Terms of Use. -
The scatter plot compares the win percentage on June 1 (about 50 games) to the final win percentage on October 3 (162 games) of every Major League Baseball team for the 2010 season. Of the 8 teams that made the playoffs in 2010, the least win total was 90. Is it possible that a team with a win percentage less than 0.500 on June 1 made the playoffs? Explain your reasoning.
-
From the graph, you can see that all of the teams with win percentages less than 0.500 on June 1 had final win percentages less than 0.550.
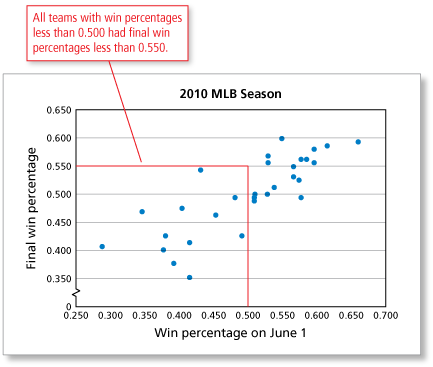
In 162 games, none of the teams with win percentages less than 0.500 on June 1 could have had a win percentage greater than 0.550. A team with a win percentage of 0.550 would have won

None of the teams with win percentages less than 0.500 on June 1 could have won more than 89.1 games. Because 89.1 is less than 90, it is not possible that a team with a win percentage less than 0.500 on June 1 made the playoffs.
These comments are not screened before publication. Constructive debate about the information on this page is welcome, but personal attacks are not. Please do not post comments that are commercial in nature or that violate copyright. Comments that we regard as obscene, defamatory, or intended to incite violence will be removed. If you find a comment offensive, you may flag it.
When posting a comment, you agree to our Terms of Use. -
-
The scatter plot compares the win percentage on June 1 (about 50 games) to the final win percentage on October 3 (162 games) of every Major League Baseball team for the 2010 season. Does the scatter plot support the following quote?
"Since 1996, only 9% of teams with a losing record on June 1 finished the season with 90 wins. "
These comments are not screened before publication. Constructive debate about the information on this page is welcome, but personal attacks are not. Please do not post comments that are commercial in nature or that violate copyright. Comments that we regard as obscene, defamatory, or intended to incite violence will be removed. If you find a comment offensive, you may flag it.
When posting a comment, you agree to our Terms of Use.