


-
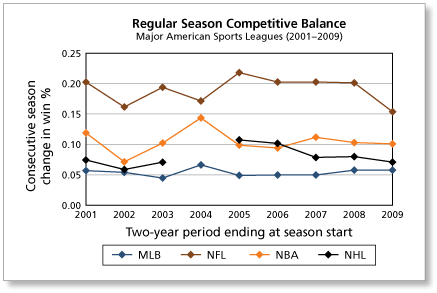
The chart shows the average absolute change in win percentage for all the teams in a league for each season shown. For instance, the value for the NBA in 2007 is based on the average absolute change in win percentages between the 2006-2007 season and the 2007-2008 season.
Identify and estimate any missing data points.
-
There is a data point missing for the NHL in 2004. Drawing a straight line between the values for 2003 and 2005, you can estimate that the value is 0.08.

Comments (0)These comments are not screened before publication. Constructive debate about the information on this page is welcome, but personal attacks are not. Please do not post comments that are commercial in nature or that violate copyright. Comments that we regard as obscene, defamatory, or intended to incite violence will be removed. If you find a comment offensive, you may flag it.
When posting a comment, you agree to our Terms of Use.Showing 0 commentsSubscribe by email Subscribe by RSSThere are no comments. -
-
The chart shows the average absolute change in win percentage for all the teams in a league for each season shown. For instance, the value for the NBA in 2007 is based on the average absolute change in win percentages between the 2006-2007 season and the 2007-2008 season.
Which major sports league has the most competitive balance? Explain your reasoning.
These comments are not screened before publication. Constructive debate about the information on this page is welcome, but personal attacks are not. Please do not post comments that are commercial in nature or that violate copyright. Comments that we regard as obscene, defamatory, or intended to incite violence will be removed. If you find a comment offensive, you may flag it.
When posting a comment, you agree to our Terms of Use. -
The chart shows the average absolute change in win percentage for all the teams in a league for each season shown. For instance, the value for the NBA in 2007 is based on the average absolute change in win percentages between the 2006-2007 season and the 2007-2008 season.
In the 2009-2010 season, an NBA team won 50 out of 82 games. How many games would you expect the team to win in the 2010-2011 season?
-
The average NBA team's win percentage varies by about 0.10 every year. In the 2009-2010 season, the team's win percentage was about 0.61.

So, next year you would expect the team's win percentage to be in the range 0.61 ± 0.10, or from 0.51 to 0.71. This means that you would expect the team to win from 0.51(82) ≈ 42 to 0.72(82) ≈ 58 games.
These comments are not screened before publication. Constructive debate about the information on this page is welcome, but personal attacks are not. Please do not post comments that are commercial in nature or that violate copyright. Comments that we regard as obscene, defamatory, or intended to incite violence will be removed. If you find a comment offensive, you may flag it.
When posting a comment, you agree to our Terms of Use. -
-
The chart shows the average absolute change in win percentage for all the teams in a league for each season shown. For instance, the value for the NBA in 2007 is based on the average absolute change in win percentages between the 2006-2007 season and the 2007-2008 season.
Do you agree with the following comment? Use the chart to explain your reasoning.

These comments are not screened before publication. Constructive debate about the information on this page is welcome, but personal attacks are not. Please do not post comments that are commercial in nature or that violate copyright. Comments that we regard as obscene, defamatory, or intended to incite violence will be removed. If you find a comment offensive, you may flag it.
When posting a comment, you agree to our Terms of Use. -
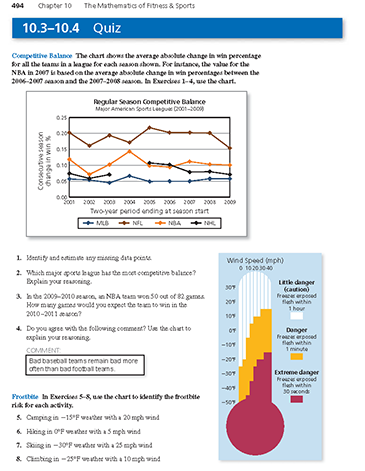
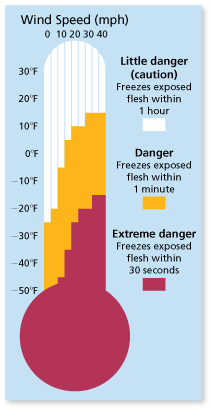
Use the chart to identify the frostbite risk for camping in -15°F weather with a 20 mph wind.
-
From the graph, you can see that -15°F weather and 20 mph wind means that there is danger of frostbite.

These comments are not screened before publication. Constructive debate about the information on this page is welcome, but personal attacks are not. Please do not post comments that are commercial in nature or that violate copyright. Comments that we regard as obscene, defamatory, or intended to incite violence will be removed. If you find a comment offensive, you may flag it.
When posting a comment, you agree to our Terms of Use. -
-
Use the chart to identify the frostbite risk for hiking in 0°F weather with a 5 mph wind.
These comments are not screened before publication. Constructive debate about the information on this page is welcome, but personal attacks are not. Please do not post comments that are commercial in nature or that violate copyright. Comments that we regard as obscene, defamatory, or intended to incite violence will be removed. If you find a comment offensive, you may flag it.
When posting a comment, you agree to our Terms of Use. -
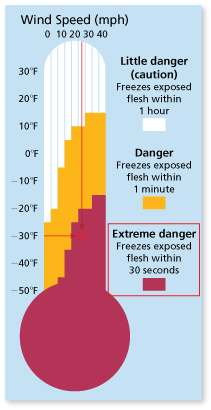
Use the chart to identify the frostbite risk for skiing in -30°F with a 25 mph wind.
-
From the graph, you can see that -30°F weather and 25 mph wind means that there is extreme danger of frostbite.
These comments are not screened before publication. Constructive debate about the information on this page is welcome, but personal attacks are not. Please do not post comments that are commercial in nature or that violate copyright. Comments that we regard as obscene, defamatory, or intended to incite violence will be removed. If you find a comment offensive, you may flag it.
When posting a comment, you agree to our Terms of Use. -
-
Use the chart to identify the frostbite risk for climbing in -25°F weather with a 10 mph wind.
These comments are not screened before publication. Constructive debate about the information on this page is welcome, but personal attacks are not. Please do not post comments that are commercial in nature or that violate copyright. Comments that we regard as obscene, defamatory, or intended to incite violence will be removed. If you find a comment offensive, you may flag it.
When posting a comment, you agree to our Terms of Use.