


-
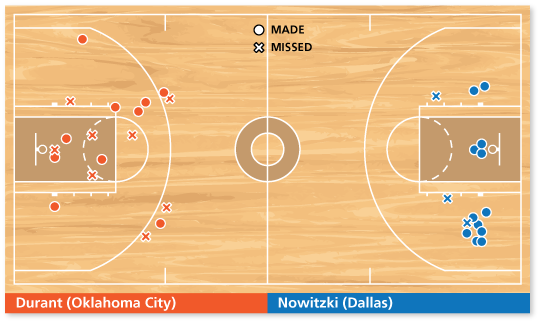
The Dallas Mavericks hosted the Oklahoma City Thunder in game 1 of the Western Conference finals on May 17, 2011. The shot chart shows the final field goal data for Kevin Durant and Dirk Nowitzki, the top scorers on each team. Which player attempted more field goals? Explain your reasoning. (See Example 5 and Example 6.)
-
Counting the number of misses (X's) and the number of makes (O's), Durant attempted 18 field goals and Nowitzki attempted 15 field goals. So, Durant attempted more field goals.
Comments (0)These comments are not screened before publication. Constructive debate about the information on this page is welcome, but personal attacks are not. Please do not post comments that are commercial in nature or that violate copyright. Comments that we regard as obscene, defamatory, or intended to incite violence will be removed. If you find a comment offensive, you may flag it.
When posting a comment, you agree to our Terms of Use.Showing 0 commentsSubscribe by email Subscribe by RSSThere are no comments. -
-
The Dallas Mavericks hosted the Oklahoma City Thunder in game 1 of the Western Conference finals on May 17, 2011. The shot chart shows the final field goal data for Kevin Durant and Dirk Nowitzki, the top scorers on each team. Field goal percentage is the number of field goals made divided by the number of field goals attempted. Which player had a greater field goal percentage? (See Example 5 and Example 6.)
These comments are not screened before publication. Constructive debate about the information on this page is welcome, but personal attacks are not. Please do not post comments that are commercial in nature or that violate copyright. Comments that we regard as obscene, defamatory, or intended to incite violence will be removed. If you find a comment offensive, you may flag it.
When posting a comment, you agree to our Terms of Use. -
The Dallas Mavericks hosted the Oklahoma City Thunder in game 1 of the Western Conference finals on May 17, 2011. The shot chart shows the final field goal data for Kevin Durant and Dirk Nowitzki, the top scorers on each team. Nowitzki had one of the most efficient playoff games in NBA history. Not only did he shoot a high percentage from the floor, he also made 24 out of 24 free throws (an NBA playoff record). How many points did Nowitzki score? (See Example 5 and Example 6.)
-
Nowitzki made 24 free throws and 12 field goals. In basketball, a free throw is worth one point. Field goals made inside the three-point line are worth two points. Field goals made outside the three-point line are worth three points. From the graph, you can see that all of Nowitzki's field goals were made inside the three-point line, so all 12 field goals are worth 2 points. To calculate the number of points that Nowitzki scored, add the points for the 24 free throws and the 12 field goals.

So, Nowitzki scored 48 points.
These comments are not screened before publication. Constructive debate about the information on this page is welcome, but personal attacks are not. Please do not post comments that are commercial in nature or that violate copyright. Comments that we regard as obscene, defamatory, or intended to incite violence will be removed. If you find a comment offensive, you may flag it.
When posting a comment, you agree to our Terms of Use. -
-
The Dallas Mavericks hosted the Oklahoma City Thunder in game 1 of the Western Conference finals on May 17, 2011. The shot chart shows the final field goal data for Kevin Durant and Dirk Nowitzki, the top scorers on each team. The Thunder's final score was 112. Nowitzki accounted for 39.7% of the Mavericks' final score. Which team won the game? Explain your reasoning. (See Example 5 and Example 6.)
These comments are not screened before publication. Constructive debate about the information on this page is welcome, but personal attacks are not. Please do not post comments that are commercial in nature or that violate copyright. Comments that we regard as obscene, defamatory, or intended to incite violence will be removed. If you find a comment offensive, you may flag it.
When posting a comment, you agree to our Terms of Use. -
The Dallas Mavericks hosted the Oklahoma City Thunder in game 1 of the Western Conference finals on May 17, 2011. The shot chart shows the final field goal data for Kevin Durant and Dirk Nowitzki, the top scorers on each team. What was Durant's 3-point field goal percentage? (See Example 5 and Example 6.)
-
Durant made 2 out of 5 shots beyond the 3-point line, so his 3-point field goal percentage is

These comments are not screened before publication. Constructive debate about the information on this page is welcome, but personal attacks are not. Please do not post comments that are commercial in nature or that violate copyright. Comments that we regard as obscene, defamatory, or intended to incite violence will be removed. If you find a comment offensive, you may flag it.
When posting a comment, you agree to our Terms of Use. -
-
The Dallas Mavericks hosted the Oklahoma City Thunder in game 1 of the Western Conference finals on May 17, 2011. The shot chart shows the final field goal data for Kevin Durant and Dirk Nowitzki, the top scorers on each team. Durant accounted for 35.7% of the Thunder's 112 points. How many free throws did he make during the game? (See Example 5 and Example 6.)
These comments are not screened before publication. Constructive debate about the information on this page is welcome, but personal attacks are not. Please do not post comments that are commercial in nature or that violate copyright. Comments that we regard as obscene, defamatory, or intended to incite violence will be removed. If you find a comment offensive, you may flag it.
When posting a comment, you agree to our Terms of Use. -
The Dallas Mavericks hosted the Oklahoma City Thunder in game 1 of the Western Conference finals on May 17, 2011. The shot chart shows the final field goal data for Kevin Durant and Dirk Nowitzki, the top scorers on each team. What observations can you make about the variability of shot selection for each player? (See Example 5 and Example 6.)
-
From the graph, you can see that the majority of Nowitzki's shots are from mid-range with a preference for the right side of the court. Durant's shots are more scattered with some close, some mid-range, and some long-range (3-point).
These comments are not screened before publication. Constructive debate about the information on this page is welcome, but personal attacks are not. Please do not post comments that are commercial in nature or that violate copyright. Comments that we regard as obscene, defamatory, or intended to incite violence will be removed. If you find a comment offensive, you may flag it.
When posting a comment, you agree to our Terms of Use. -
-
Would you rather shoot 40% from 3-point range or 50% from inside the 3-point line? Explain your reasoning.
These comments are not screened before publication. Constructive debate about the information on this page is welcome, but personal attacks are not. Please do not post comments that are commercial in nature or that violate copyright. Comments that we regard as obscene, defamatory, or intended to incite violence will be removed. If you find a comment offensive, you may flag it.
When posting a comment, you agree to our Terms of Use.