


-
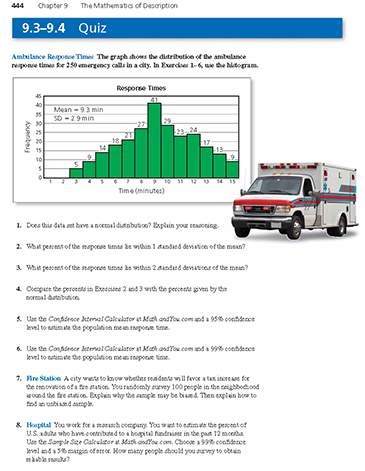
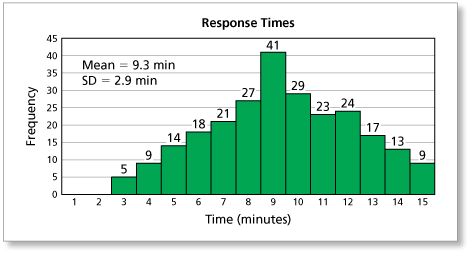
The histogram shows the distribution of the ambulance response times for 250 emergency calls in a city. Does this data set have a normal distribution? Explain your reasoning.
-
The shape of the distribution is approximately bell-shaped, so the data appears to have a normal distribution.
Comments (0)These comments are not screened before publication. Constructive debate about the information on this page is welcome, but personal attacks are not. Please do not post comments that are commercial in nature or that violate copyright. Comments that we regard as obscene, defamatory, or intended to incite violence will be removed. If you find a comment offensive, you may flag it.
When posting a comment, you agree to our Terms of Use.Showing 0 commentsSubscribe by email Subscribe by RSSThere are no comments. -
-
The histogram shows the distribution of the ambulance response times for 250 emergency calls in a city. What percent of the response times lie within 1 standard deviation of the mean?
These comments are not screened before publication. Constructive debate about the information on this page is welcome, but personal attacks are not. Please do not post comments that are commercial in nature or that violate copyright. Comments that we regard as obscene, defamatory, or intended to incite violence will be removed. If you find a comment offensive, you may flag it.
When posting a comment, you agree to our Terms of Use. -
The histogram shows the distribution of the ambulance response times for 250 emergency calls in a city. What percent of the response times lie within 2 standard deviations of the mean?
-
The mean is about 9 minutes and the standard deviation is about 3 minutes. Data values that lie within 2 standard deviations lie within the range 9 - 2(3) to 9 + 2(3), or 3 minutes to 15 minutes.
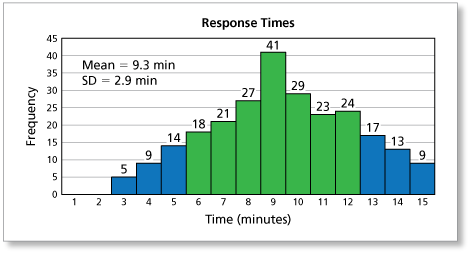
All of the response times lie within 2 standard deviations of the mean, so 100% of the response times lie within 2 standard deviations of the mean.
These comments are not screened before publication. Constructive debate about the information on this page is welcome, but personal attacks are not. Please do not post comments that are commercial in nature or that violate copyright. Comments that we regard as obscene, defamatory, or intended to incite violence will be removed. If you find a comment offensive, you may flag it.
When posting a comment, you agree to our Terms of Use. -
-
The histogram shows the distribution of the ambulance response times for 250 emergency calls in a city. Compare the percents in Exercises 2 and 3 with the percents given by the normal distribution.
These comments are not screened before publication. Constructive debate about the information on this page is welcome, but personal attacks are not. Please do not post comments that are commercial in nature or that violate copyright. Comments that we regard as obscene, defamatory, or intended to incite violence will be removed. If you find a comment offensive, you may flag it.
When posting a comment, you agree to our Terms of Use. -
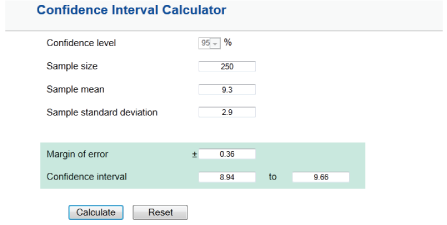
The histogram shows the distribution of the ambulance response times for 250 emergency calls in a city. Use the Confidence Interval Calculator and a 95% confidence level to estimate the population mean response time.
-
Using the Confidence Interval Calculator located in Tools, you can obtain the following.
- 95% Confidence Level: The population mean is 9.3 minutes ± 0.36 minute.
These comments are not screened before publication. Constructive debate about the information on this page is welcome, but personal attacks are not. Please do not post comments that are commercial in nature or that violate copyright. Comments that we regard as obscene, defamatory, or intended to incite violence will be removed. If you find a comment offensive, you may flag it.
When posting a comment, you agree to our Terms of Use. -
-
The histogram shows the distribution of the ambulance response times for 250 emergency calls in a city. Use the Confidence Interval Calculator and a 99% confidence level to estimate the population mean response time.
These comments are not screened before publication. Constructive debate about the information on this page is welcome, but personal attacks are not. Please do not post comments that are commercial in nature or that violate copyright. Comments that we regard as obscene, defamatory, or intended to incite violence will be removed. If you find a comment offensive, you may flag it.
When posting a comment, you agree to our Terms of Use. -
A city wants to know whether residents will favor a tax increase for the renovation of a fire station. You randomly survey 100 people in the neighborhood around the fire station. Explain why the sample may be biased. Then explain how to find an unbiased sample.
-
The sample may be biased because people in the neighborhood around the fire station are more likely to want the fire station renovated. To find an unbiased sample, the city should survey a random sample of people in the city.
These comments are not screened before publication. Constructive debate about the information on this page is welcome, but personal attacks are not. Please do not post comments that are commercial in nature or that violate copyright. Comments that we regard as obscene, defamatory, or intended to incite violence will be removed. If you find a comment offensive, you may flag it.
When posting a comment, you agree to our Terms of Use. -
-
You work for a research company. You want to estimate the percent of U.S. adults who have contributed to a hospital fundraiser in the past 12 months. Use the Sample Size Calculator. Choose a 99% confidence level and a 5% margin of error. How many people should you survey to obtain reliable results?
These comments are not screened before publication. Constructive debate about the information on this page is welcome, but personal attacks are not. Please do not post comments that are commercial in nature or that violate copyright. Comments that we regard as obscene, defamatory, or intended to incite violence will be removed. If you find a comment offensive, you may flag it.
When posting a comment, you agree to our Terms of Use.