


-
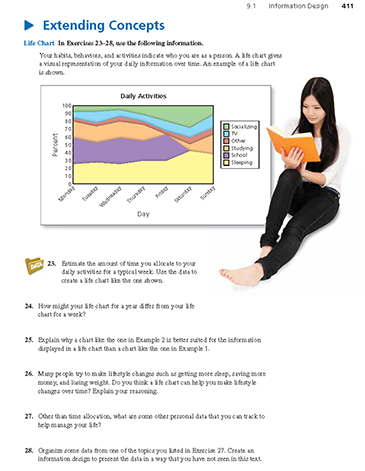
Your habits, behaviors, and activities indicate who you are as a person. A life chart gives a visual representation of your daily information over time. An example of a life chart is shown.
Estimate the amount of time you allocate to your daily activities for a typical week. Use the data to create a life chart like the one shown.

-
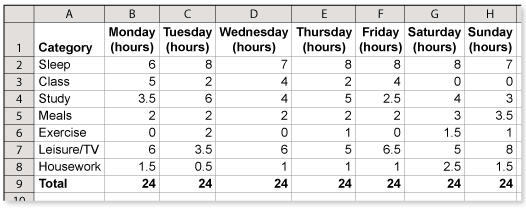
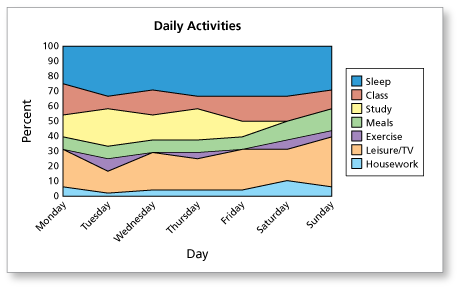
An easy way to show the time you spend on your daily activities is to enter the times into a spreadsheet. Then you can use a spreadsheet area chart to create a life chart for your data.
Sample answer:
Comments (0)These comments are not screened before publication. Constructive debate about the information on this page is welcome, but personal attacks are not. Please do not post comments that are commercial in nature or that violate copyright. Comments that we regard as obscene, defamatory, or intended to incite violence will be removed. If you find a comment offensive, you may flag it.
When posting a comment, you agree to our Terms of Use.Showing 0 commentsSubscribe by email Subscribe by RSSThere are no comments. -
-
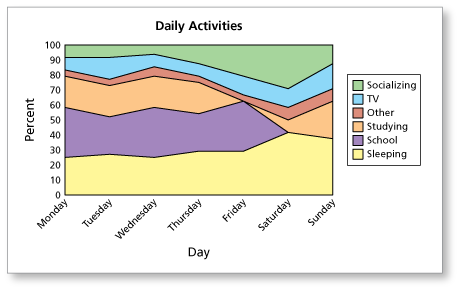
Your habits, behaviors, and activities indicate who you are as a person. A life chart gives a visual representation of your daily information over time. An example of a life chart is shown.
How might your life chart for a year differ from your life chart for a week?
These comments are not screened before publication. Constructive debate about the information on this page is welcome, but personal attacks are not. Please do not post comments that are commercial in nature or that violate copyright. Comments that we regard as obscene, defamatory, or intended to incite violence will be removed. If you find a comment offensive, you may flag it.
When posting a comment, you agree to our Terms of Use. -
Your habits, behaviors, and activities indicate who you are as a person. A life chart gives a visual representation of your daily information over time. An example of a life chart is shown.
Explain why a chart like the one in Example 2 is better suited for the information displayed in a life chart than a chart like the one in Example 1.
-
The life chart above shows the changing parts of a whole in terms of the percents of the day spent on daily activities.
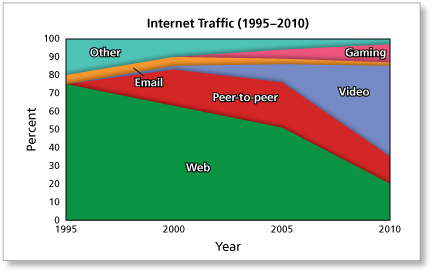
Likewise, the stacked area graph in Example 2 (below) shows the changing parts of a whole in terms of the percents of the total Internet bit usage attributed to the different Internet activities.
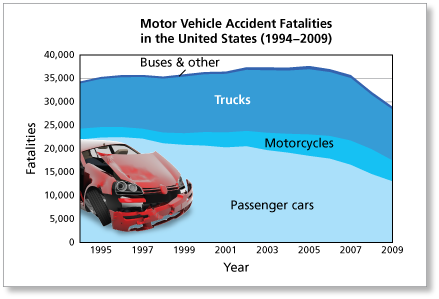
The stacked area graph in Example 1 (below), however, does not show parts of a whole in terms of percents that add up to 100%. Instead, it shows the numbers of accident fatalities in each category, and the total of the accidents for all the categories is a number that changes over time.
These comments are not screened before publication. Constructive debate about the information on this page is welcome, but personal attacks are not. Please do not post comments that are commercial in nature or that violate copyright. Comments that we regard as obscene, defamatory, or intended to incite violence will be removed. If you find a comment offensive, you may flag it.
When posting a comment, you agree to our Terms of Use. -
-
Your habits, behaviors, and activities indicate who you are as a person. A life chart gives a visual representation of your daily information over time. An example of a life chart is shown.
Many people try to make lifestyle changes such as getting more sleep, saving more money, and losing weight. Do you think a life chart can help you make lifestyle changes over time? Explain your reasoning.
These comments are not screened before publication. Constructive debate about the information on this page is welcome, but personal attacks are not. Please do not post comments that are commercial in nature or that violate copyright. Comments that we regard as obscene, defamatory, or intended to incite violence will be removed. If you find a comment offensive, you may flag it.
When posting a comment, you agree to our Terms of Use. -
Other than time allocation, what are some other personal data that you can track to help manage your life?
-
There are many types of personal data that you can track to help manage your life. Several of these are income, expenses, debt, retirement savings, body weight, blood pressure, cholesterol level, food consumption, exercise routine, study routine, social habits, personal goal accomplishment, etc.
These comments are not screened before publication. Constructive debate about the information on this page is welcome, but personal attacks are not. Please do not post comments that are commercial in nature or that violate copyright. Comments that we regard as obscene, defamatory, or intended to incite violence will be removed. If you find a comment offensive, you may flag it.
When posting a comment, you agree to our Terms of Use. -
-
Organize some data from one of the topics you listed in Exercise 27. Create an information design to present the data in a way that you have not seen in this textbook.
These comments are not screened before publication. Constructive debate about the information on this page is welcome, but personal attacks are not. Please do not post comments that are commercial in nature or that violate copyright. Comments that we regard as obscene, defamatory, or intended to incite violence will be removed. If you find a comment offensive, you may flag it.
When posting a comment, you agree to our Terms of Use.