


-
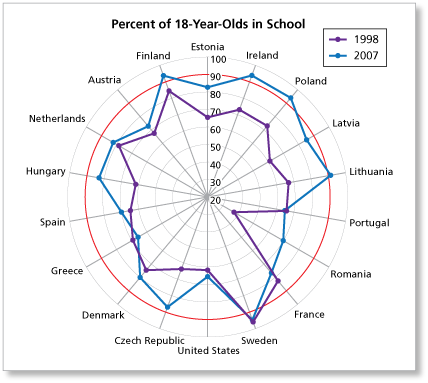
You can use a spreadsheet to create a radar graph similar to the one in Example 3 using the steps below.
-
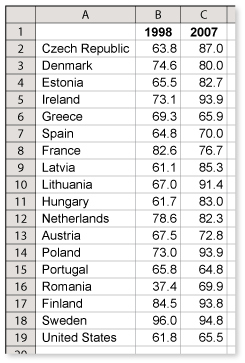
Create a spreadsheet like the one shown.
-
Select cells A1 through A19, B1 through B19, and C1 through C19.
-
From the Insert menu, choose Chart....
-
Select the Standard Types tab. Under Chart type:, select Radar. Then click Next.
-
Click Next again.
-
Select the Titles tab. Enter "Percent of 18-Year-Olds in School " for Chart title:. Click Finish.
-
-
Did you know you can access online libraries and read for free? Visit EduChoices for a list of 25 places to read free books online.
-
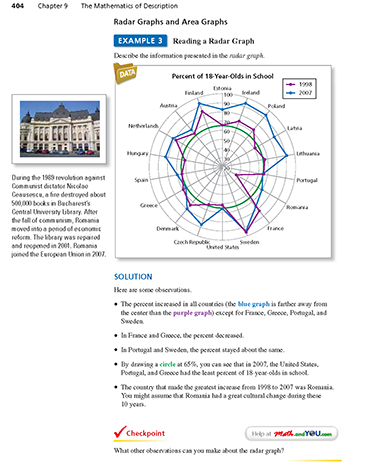
Sample answer:
Here are some other observations that you can make about the radar graph.
- Eight of the countries experienced a large increase in the percent of 18-year-olds in school (more than an additional 10% in school). Those countries are the Czech Republic, Estonia, Hungary, Ireland, Latvia, Lithuania, Poland, and Romania.
- Sweden had the greatest percent of students enrolled in school in both 1998 and 2007.
- By drawing a circle at 90%, you can see that in 2007, Finland, Lithuania, Poland, and Sweden had more than 90% of 18-year-olds enrolled in school.
-
Comments (1)
These comments are not screened before publication. Constructive debate about the information on this page is welcome, but personal attacks are not. Please do not post comments that are commercial in nature or that violate copyright. Comments that we regard as obscene, defamatory, or intended to incite violence will be removed. If you find a comment offensive, you may flag it.
When posting a comment, you agree to our Terms of Use.Showing 1 commentsSubscribe by email Subscribe by RSS Ron Larson (author)1 decade ago |Radar graphs are relatively new. I included them in the book because you will occasionally run into them. I should admit, however, that I am not a big fan of radar graphs.0 0