


-
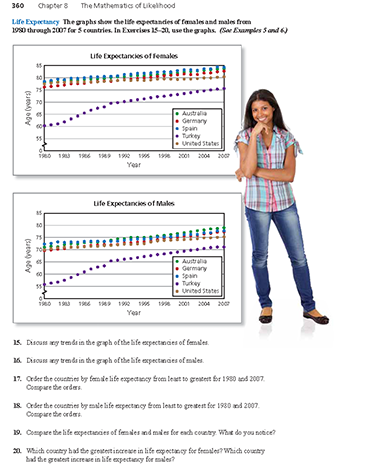
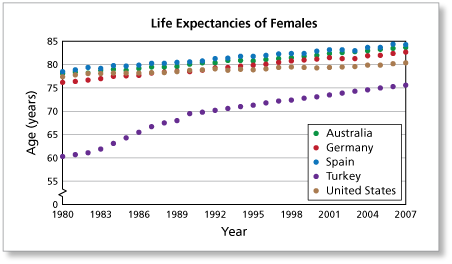
The graph shows the life expectancies of females from 1980 through 2007 for 5 countries. Discuss any trends in the graph of life expectancies of females. (See Example 5 and Example 6.)
-
The life expectancy for females increased in each country. In Australia, Germany, Spain, and the United States, life expectancy increased at about the same rate. The female life expectancy in Turkey increased at a greater rate than the other countries.
Comments (0)These comments are not screened before publication. Constructive debate about the information on this page is welcome, but personal attacks are not. Please do not post comments that are commercial in nature or that violate copyright. Comments that we regard as obscene, defamatory, or intended to incite violence will be removed. If you find a comment offensive, you may flag it.
When posting a comment, you agree to our Terms of Use.Showing 0 commentsSubscribe by email Subscribe by RSSThere are no comments. -
-
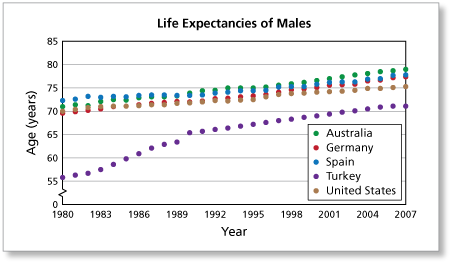
The graph shows the life expectancies of males from 1980 through 2007 for 5 countries. Discuss any trends in the graph of the life expectancies of males. (See Example 5 and Example 6.)
These comments are not screened before publication. Constructive debate about the information on this page is welcome, but personal attacks are not. Please do not post comments that are commercial in nature or that violate copyright. Comments that we regard as obscene, defamatory, or intended to incite violence will be removed. If you find a comment offensive, you may flag it.
When posting a comment, you agree to our Terms of Use. -
Order the countries by female life expectancy from least to greatest for 1980 and 2007. Compare the orders. (See Example 5 and Example 6.)
-
1980
Turkey: 60
Germany: 76
United States: 77
Australia: 78
Spain: 79
2007
Turkey: 76
United States: 81
Germany: 83
Australia: 84
Spain: 84
Germany and the United States switched orders. Spain still has the greatest female life expectancy and Turkey still has the least female life expectancy.
These comments are not screened before publication. Constructive debate about the information on this page is welcome, but personal attacks are not. Please do not post comments that are commercial in nature or that violate copyright. Comments that we regard as obscene, defamatory, or intended to incite violence will be removed. If you find a comment offensive, you may flag it.
When posting a comment, you agree to our Terms of Use. -
-
Order the countries by male life expectancy from least to greatest for 1980 and 2007. Compare the orders. (See Example 5 and Example 6.)
These comments are not screened before publication. Constructive debate about the information on this page is welcome, but personal attacks are not. Please do not post comments that are commercial in nature or that violate copyright. Comments that we regard as obscene, defamatory, or intended to incite violence will be removed. If you find a comment offensive, you may flag it.
When posting a comment, you agree to our Terms of Use. -
Compare the life expectancy of females and males for each country. What do you notice? (See Example 5 and Example 6.)
-
Here are some observations.
- In Each country in 1980, the life expectancy for females was greater than for males.
- In Each country in 2007, the life expectancy for females was greater than for males.
- In each country and for each year, the life expectancy for females was about 5 years greater than for males.
These comments are not screened before publication. Constructive debate about the information on this page is welcome, but personal attacks are not. Please do not post comments that are commercial in nature or that violate copyright. Comments that we regard as obscene, defamatory, or intended to incite violence will be removed. If you find a comment offensive, you may flag it.
When posting a comment, you agree to our Terms of Use. -
-
Which country had the greatest increase in life expectancy for females? Which country had the greatest increase in life expectancy for males? (See Example 5 and Example 6.)
These comments are not screened before publication. Constructive debate about the information on this page is welcome, but personal attacks are not. Please do not post comments that are commercial in nature or that violate copyright. Comments that we regard as obscene, defamatory, or intended to incite violence will be removed. If you find a comment offensive, you may flag it.
When posting a comment, you agree to our Terms of Use.