


-
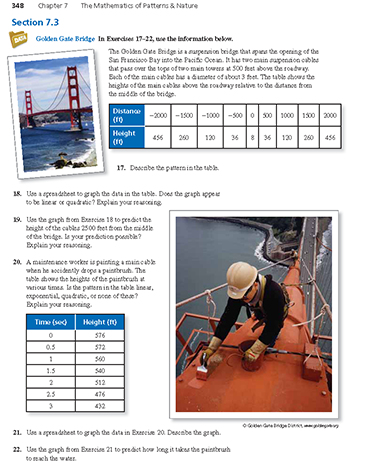
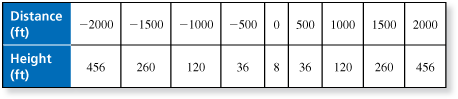
The Golden Gate Bridge is a suspension bridge that spans the opening of the San Francisco Bay into the Pacific Ocean. It has two main suspension cables that pass over the tops of two main towers at 500 feet above the roadway. Each of the main cables has a diameter of about 3 feet. The table shows the heights of the main cables above the roadway relative to the distance from the middle of the bridge.
Describe the pattern in the table.

-
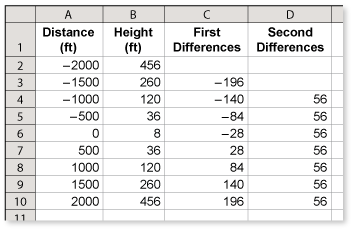
Enter the data into a spreadsheet. Because the second differences are equal, the pattern is quadratic.
Comments (0)These comments are not screened before publication. Constructive debate about the information on this page is welcome, but personal attacks are not. Please do not post comments that are commercial in nature or that violate copyright. Comments that we regard as obscene, defamatory, or intended to incite violence will be removed. If you find a comment offensive, you may flag it.
When posting a comment, you agree to our Terms of Use.Showing 0 commentsSubscribe by email Subscribe by RSSThere are no comments. -
-
The Golden Gate Bridge is a suspension bridge that spans the opening of the San Francisco Bay into the Pacific Ocean. It has two main suspension cables that pass over the tops of two main towers at 500 feet above the roadway. Each of the main cables has a diameter of about 3 feet. The table shows the heights of the main cables above the roadway relative to the distance from the middle of the bridge.
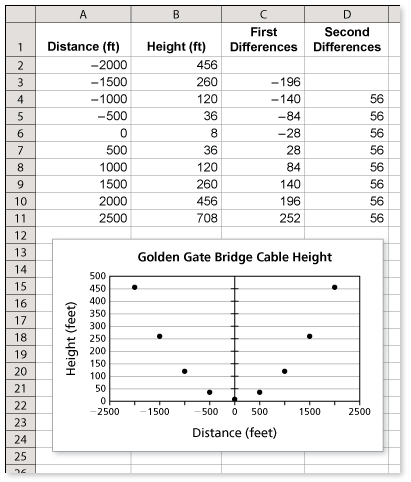
Use a spreadsheet to graph the data in the table. Does the graph appear to be linear or quadratic? Explain your reasoning.
These comments are not screened before publication. Constructive debate about the information on this page is welcome, but personal attacks are not. Please do not post comments that are commercial in nature or that violate copyright. Comments that we regard as obscene, defamatory, or intended to incite violence will be removed. If you find a comment offensive, you may flag it.
When posting a comment, you agree to our Terms of Use. -
The Golden Gate Bridge is a suspension bridge that spans the opening of the San Francisco Bay into the Pacific Ocean. It has two main suspension cables that pass over the tops of two main towers at 500 feet above the roadway. Each of the main cables has a diameter of about 3 feet. The table shows the heights of the main cables above the roadway relative to the distance from the middle of the bridge.
Use the graph from Exercise 18 to predict the height of the cables 2500 feet from the middle of the bridge. Is your prediction possible? Explain your reasoning.
-
By extending the spreadsheet as shown, you can see that the height of the cables 2500 feet from the middle of the bridge will be about 708 feet. This is not possible because the main towers are only 500 feet above the roadway.
These comments are not screened before publication. Constructive debate about the information on this page is welcome, but personal attacks are not. Please do not post comments that are commercial in nature or that violate copyright. Comments that we regard as obscene, defamatory, or intended to incite violence will be removed. If you find a comment offensive, you may flag it.
When posting a comment, you agree to our Terms of Use. -
-
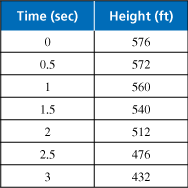
A maintenance worker is painting a main cable when he accidently drops a paintbrush. The table shows the heights of the paintbrush at various times. Is the pattern in the table linear, exponential, quadratic, or none of these? Explain your reasoning.
These comments are not screened before publication. Constructive debate about the information on this page is welcome, but personal attacks are not. Please do not post comments that are commercial in nature or that violate copyright. Comments that we regard as obscene, defamatory, or intended to incite violence will be removed. If you find a comment offensive, you may flag it.
When posting a comment, you agree to our Terms of Use. -
A maintenance worker is painting a main cable when he accidently drops a paintbrush. The table shows the heights of the paintbrush at various times.
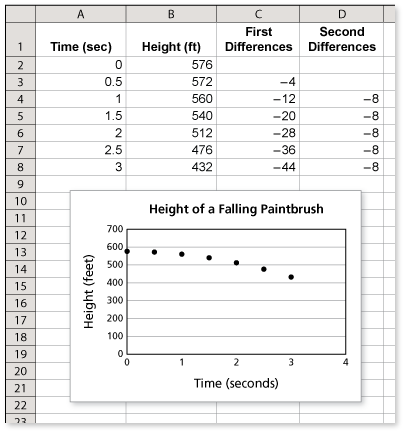
Use a spreadsheet to graph the data. Describe the graph.
-
The graph shows a quadratic pattern. From the spreadsheet, you can see that with each additional half second, the speed of the falling paintbrush is increasing.
These comments are not screened before publication. Constructive debate about the information on this page is welcome, but personal attacks are not. Please do not post comments that are commercial in nature or that violate copyright. Comments that we regard as obscene, defamatory, or intended to incite violence will be removed. If you find a comment offensive, you may flag it.
When posting a comment, you agree to our Terms of Use. -
-
Use the graph from Exercise 21 to predict how long it takes the paintbrush to reach the water.
These comments are not screened before publication. Constructive debate about the information on this page is welcome, but personal attacks are not. Please do not post comments that are commercial in nature or that violate copyright. Comments that we regard as obscene, defamatory, or intended to incite violence will be removed. If you find a comment offensive, you may flag it.
When posting a comment, you agree to our Terms of Use.