


-
You can use Excel to find the best-fitting line for a data set. Enter the data into a spreadsheet. Make a scatter plot of the data. Click on the scatter plot. From the chart menu, choose "Add Trendline." Click on the "Options" tab. Check the box labeled "Display equation on chart." Click "OK." This will add the best-fitting line and its equation to your scatter plot.
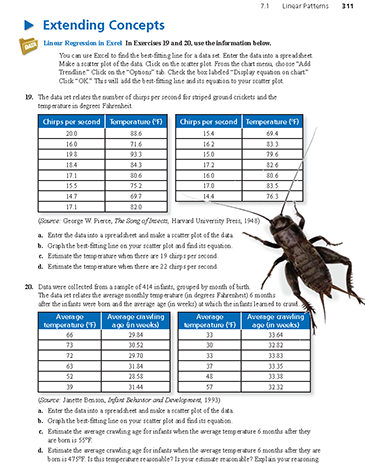
The data set relates the number of chirps per second for striped ground crickets and the temperature in degrees Fahrenheit.
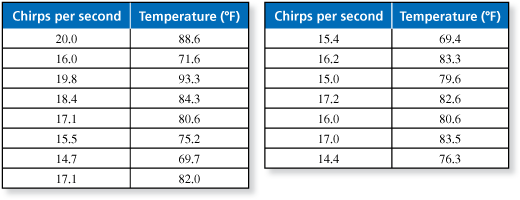
- Enter the data into a spreadsheet and make a scatter plot of the data.
- Graph the best-fitting line on your scatter plot and find its equation.
- Estimate the temperature when there are 19 chirps per second.
- Estimate the temperature when there are 22 chirps per second.

-
- The spreadsheet is shown below.
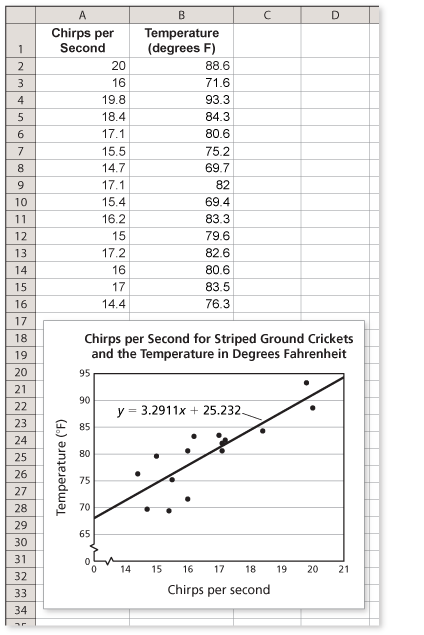
- The best-fitting line is shown on the scatter plot.
- For 19 chirps per second, the temperature estimated by the linear equation is

- For 22 chirps per second, the temperature estimated by the linear equation is

- The spreadsheet is shown below.
Comments (0)These comments are not screened before publication. Constructive debate about the information on this page is welcome, but personal attacks are not. Please do not post comments that are commercial in nature or that violate copyright. Comments that we regard as obscene, defamatory, or intended to incite violence will be removed. If you find a comment offensive, you may flag it.
When posting a comment, you agree to our Terms of Use.Showing 0 commentsSubscribe by email Subscribe by RSSThere are no comments. -
You can use Excel to find the best-fitting line for a data set. Enter the data into a spreadsheet. Make a scatter plot of the data. Click on the scatter plot. From the chart menu, choose "Add Trendline." Click on the "Options" tab. Check the box labeled "Display equation on chart." Click "OK." This will add the best-fitting line and its equation to your scatter plot.
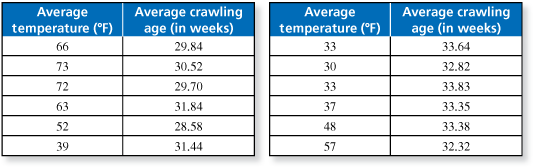
Data were collected from a sample of 414 infants, grouped by month of birth. The data set relates the average monthly temperature (in degrees Fahrenheit) six months after the infants were born and the average age (in weeks) at which the infants learned to crawl.
(Source: Janette Benson, Infant Behavior and Development, 1993)
- Enter the data into a spreadsheet and make a scatter plot of the data.
- Graph the best-fitting line on your scatter plot and find its equation.
- Estimate the average crawling age for infants when the average temperature 6 months after they are born is 55°F.
- Estimate the average crawling age for infants when the average temperature 6 months after they are born is 475°F. Is this temperature reasonable? Is your estimate reasonable? Explain your reasoning.
These comments are not screened before publication. Constructive debate about the information on this page is welcome, but personal attacks are not. Please do not post comments that are commercial in nature or that violate copyright. Comments that we regard as obscene, defamatory, or intended to incite violence will be removed. If you find a comment offensive, you may flag it.
When posting a comment, you agree to our Terms of Use.