


-
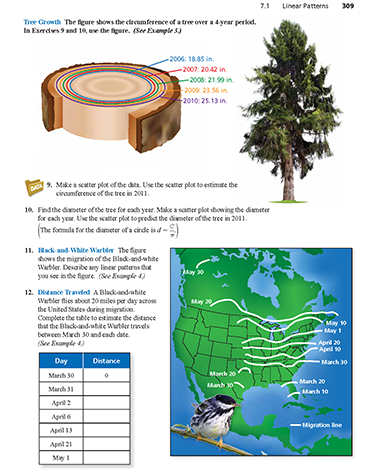
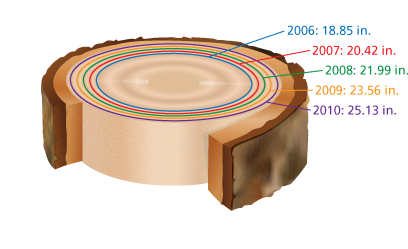
The figure shows the circumference of a tree over a 4-year period. Make a scatter plot of the data. Use the scatter plot to estimate the circumference of the tree in 2011. (See Example 3.)

-
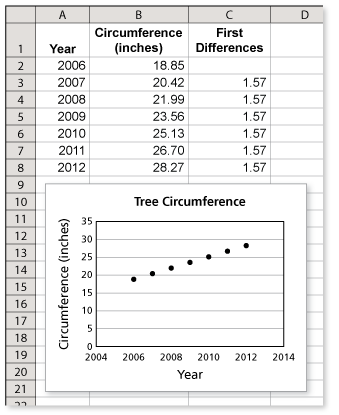
Enter the data into a spreadsheet. Then sketch a graph. From the graph you can see that the pattern is linear. Notice that each time the year increases by 1, the circumference increases by 1.57 inches. Knowing that the circumference in 2010 is 25.13 inches, you can predict that the circumference in 2011 is

Comments (1)These comments are not screened before publication. Constructive debate about the information on this page is welcome, but personal attacks are not. Please do not post comments that are commercial in nature or that violate copyright. Comments that we regard as obscene, defamatory, or intended to incite violence will be removed. If you find a comment offensive, you may flag it.
When posting a comment, you agree to our Terms of Use.Showing 1 commentsSubscribe by email Subscribe by RSS Cody (moderator)1 decade ago |The rings found in the center of a tree act as a narrative of a tree's life. Just by looking at a tree's rings you can learn it's age, whether it has been through a fire, if the tree had to compete with other trees for nutrients, and many other details.3 0
 -
-
The figure shows the circumference of a tree over a 4-year period. Find the diameter of the tree for each year. Make a scatter plot showing the diameter for each year. Use the scatter plot to predict the diameter of the tree in 2011. (The formula for the diameter of a circle is
 ) (See Example 3.)
These comments are not screened before publication. Constructive debate about the information on this page is welcome, but personal attacks are not. Please do not post comments that are commercial in nature or that violate copyright. Comments that we regard as obscene, defamatory, or intended to incite violence will be removed. If you find a comment offensive, you may flag it.
When posting a comment, you agree to our Terms of Use. -
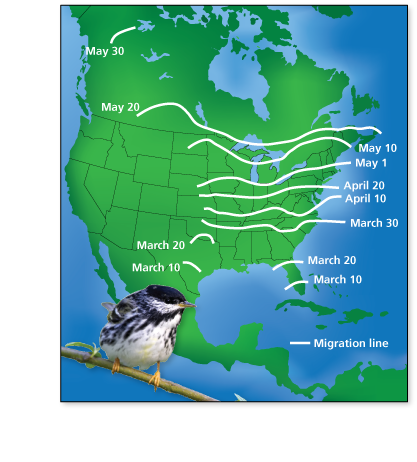
The figure shows the migration of the Black-and-White Warbler. Describe any linear patterns that you see in the figure. (See Example 4.)
-
In the central part of the United States, the migration moves from the southern part of Tennessee to Lake Superior. This is a distance of roughly 1000 miles. The migration occurred from March 30 to May 20 (about 50 days). So, the warbler is migrating at a rate of about

Because the space between the migration lines (in the central part of the U.S.) is about the same, you can conclude that the warbler's migration pattern is roughly linear.
These comments are not screened before publication. Constructive debate about the information on this page is welcome, but personal attacks are not. Please do not post comments that are commercial in nature or that violate copyright. Comments that we regard as obscene, defamatory, or intended to incite violence will be removed. If you find a comment offensive, you may flag it.
When posting a comment, you agree to our Terms of Use. -
-
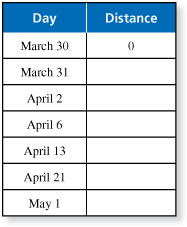
A Black-and-white Warbler flies about 20 miles per day across the United States during migration. Complete the table to estimate the distance that the Black-and-white Warbler travels between March 30 and each date. (See Example 4.)
These comments are not screened before publication. Constructive debate about the information on this page is welcome, but personal attacks are not. Please do not post comments that are commercial in nature or that violate copyright. Comments that we regard as obscene, defamatory, or intended to incite violence will be removed. If you find a comment offensive, you may flag it.
When posting a comment, you agree to our Terms of Use.