


-
You can use a spreadsheet to draw a "best-fitting line" similar to the one in Example 3 using the steps below.
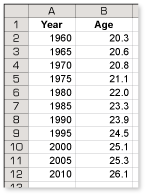
- Create a spreadsheet like the one shown.
- Select cells A2 through A20 and B2 through B20.
- From the Insert menu, choose Chart....
- Select the Standard Types tab. Under Chart type:, select XY (Scatter). Then click Next.
- Click Next again.
- Select the Titles tab. Enter "Ages of Women at First Marriage (U.S.)" for Chart title:, "Year" for Value (X) axis:, and "Age" for Value (Y) axis:.
- Select the Legend tab. Uncheck Show legend. Click Finish.
- Select the scatter plot. From the Chart menu, choose Add Trendline....
- Select the Type tab. Under Trend/Regression type, choose Linear.
- Select the Options tab. Under Forecast, enter 10 for Forward. Click OK.
-
The average cost of a wedding is between $18,000 and $30,000, depending on the extravagance and location of the event. To figure out what a big day might run, try this wedding cost calculator.
-
From the approximate best fit line, it looks like the marriage rate will be about 23 marriages per 1000 unmarried women in 2020.
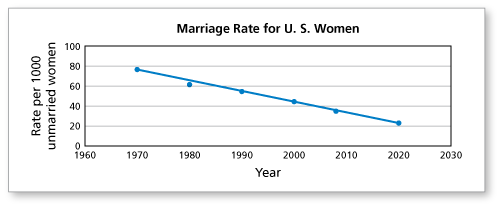
Example 3 shows that women have been getting married at later ages over the past few decades. The data in this checkpoint show that the percentage of women getting married at all has been declining. It makes sense that with more women waiting until they're older to get married, fewer total women would get married.
-
Comments (1)
These comments are not screened before publication. Constructive debate about the information on this page is welcome, but personal attacks are not. Please do not post comments that are commercial in nature or that violate copyright. Comments that we regard as obscene, defamatory, or intended to incite violence will be removed. If you find a comment offensive, you may flag it.
When posting a comment, you agree to our Terms of Use.Showing 1 commentsSubscribe by email Subscribe by RSS Ron Larson (author)1 decade ago |As you can see from the graph in Example 3, patterns involving the social actions of humans are often not exactly linear. Yet, the pattern is linear enough to allow us to make educated predictions.1 0