


-
There are 3 things that you should notice about Example 2.
-
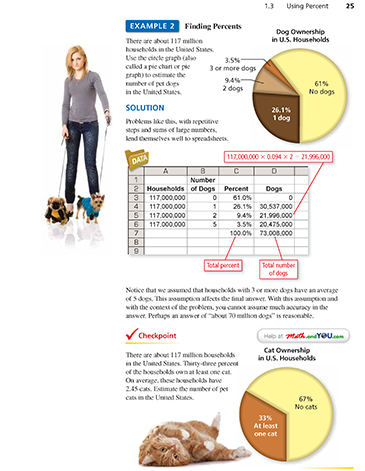
The parts of a circle graph always total 100%. In this case, you have

- You should take statistics, like the ones in Example 2, as rough estimates. After all, how could anyone know how many dogs live in the United States?
-
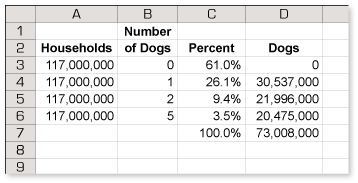
The solution in Example 2 produced an estimate of 73 million dogs in the United States. The American Veterinary Medical Association puts the estimate at about 72 million. Try downloading the spreadsheet below. Change the estimate for the average number of dogs owned by households with 3 or more dogs to see if you can get a total that agrees with the AVMA.

-
-
 Do you own a pet? Visit the The American Society for the Prevention of Cruelty to Animals website at ASPCA.org to learn about pet care for your dog, cat, horse, or other pets. You can also read The Top 10 Ways to Prevent Animal Cruelty in your community.
 -
This is a straightforward question. Even so, remembering to label each factor in the product with its units helps to see that the product is set up correctly.

There are about 95 million pet cats in the United States.
As you might imagine, sources disagree on this number. The American Veterinary Medical Association claims that 32.4% of households own cats, with an average ownership of 2.2 cats. This puts the AVMA's estimate for the total number of cats in the United States at about 83 million.
Unit Analysis Using Percent
When using unit analysis with percent, remember that a percent is a ratio that has the same units in the numerator and denominator. Because these "same units" cancel each other, we usually say that a percent has no units.
-
Comments (1)
These comments are not screened before publication. Constructive debate about the information on this page is welcome, but personal attacks are not. Please do not post comments that are commercial in nature or that violate copyright. Comments that we regard as obscene, defamatory, or intended to incite violence will be removed. If you find a comment offensive, you may flag it.
When posting a comment, you agree to our Terms of Use.Showing 1 commentsSubscribe by email Subscribe by RSS Ron Larson (author)1 decade ago |When you see data sets like this one, on the number of cats and dogs in the United States, try to imagine how one might obtain the data. Numbers for this data set would have been found by statistical sampling and not by taking an actual census. So, you should expect that the numbers might be off by a few or even several million.0 0