


-
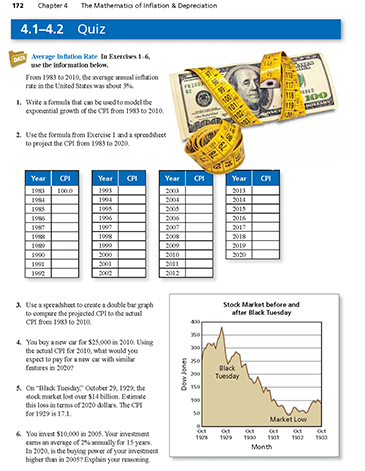
From 1983 to 2010, the average annual inflation rate in the United States was about 3%. Write a formula that can be used to model the exponential growth of the consumer price index from 1983 to 2010.

-
Use the general formula for exponential growth.

P = 100, r = 3%, n is measured in years with n = 0 representing 1983
Comments (0)These comments are not screened before publication. Constructive debate about the information on this page is welcome, but personal attacks are not. Please do not post comments that are commercial in nature or that violate copyright. Comments that we regard as obscene, defamatory, or intended to incite violence will be removed. If you find a comment offensive, you may flag it.
When posting a comment, you agree to our Terms of Use.Showing 0 commentsSubscribe by email Subscribe by RSSThere are no comments. -
-
From 1983 to 2010, the average annual inflation rate in the United States was about 3%. Use the formula from Exercise 1 and a spreadsheet to project the consumer price index from 1983 to 2020.

These comments are not screened before publication. Constructive debate about the information on this page is welcome, but personal attacks are not. Please do not post comments that are commercial in nature or that violate copyright. Comments that we regard as obscene, defamatory, or intended to incite violence will be removed. If you find a comment offensive, you may flag it.
When posting a comment, you agree to our Terms of Use. -
Use a spreadsheet to create a double bar graph to compare the projected consumer price index to the actual consumer price index from 1983 to 2010.
-
From Exercise 1, a model for the consumer price index is

P = 100, r = 3%, n is measured in years with n = 0 representing 1983
By entering the actual CPI together with this formula into a spreadsheet, you can obtain the following graph.
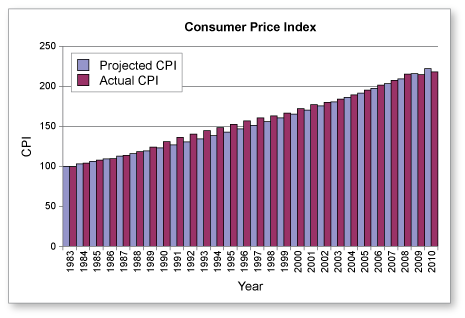
Overall, the formula models the actual consumer price index fairly well. It is somewhat off in the 1990s because 1990 and 1991 were years of high inflation.
These comments are not screened before publication. Constructive debate about the information on this page is welcome, but personal attacks are not. Please do not post comments that are commercial in nature or that violate copyright. Comments that we regard as obscene, defamatory, or intended to incite violence will be removed. If you find a comment offensive, you may flag it.
When posting a comment, you agree to our Terms of Use. -
-
From 1983 to 2010, the average annual inflation rate in the United States was about 3%. You buy a new car for $25,000 in 2010. Using the actual CPI for 2010, what would you expect to pay for a new car with similar features in 2020?
These comments are not screened before publication. Constructive debate about the information on this page is welcome, but personal attacks are not. Please do not post comments that are commercial in nature or that violate copyright. Comments that we regard as obscene, defamatory, or intended to incite violence will be removed. If you find a comment offensive, you may flag it.
When posting a comment, you agree to our Terms of Use. -
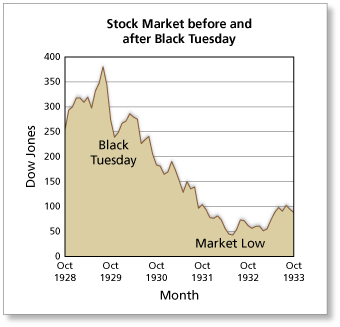
On "Black Tuesday", October 29, 1929, the stock market lost over $14 billion. Estimate this loss in terms of 2020 dollars. The consumer price index for 1929 is 17.1.
-
The projected consumer price index for 2020 is

Because the CPI was 17.1 in 1929, you can estimate that $14 billion in 1929 would be worth
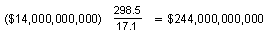
in 2020. In other words, the loss would be almost a quarter of a trillion dollars.
These comments are not screened before publication. Constructive debate about the information on this page is welcome, but personal attacks are not. Please do not post comments that are commercial in nature or that violate copyright. Comments that we regard as obscene, defamatory, or intended to incite violence will be removed. If you find a comment offensive, you may flag it.
When posting a comment, you agree to our Terms of Use. -
-
You invest $10,000 in 2005. Your investment earns an average of 2% annually for 15 years. In 2020, is the buying power of your investment higher than in 2005? Explain your reasoning.
These comments are not screened before publication. Constructive debate about the information on this page is welcome, but personal attacks are not. Please do not post comments that are commercial in nature or that violate copyright. Comments that we regard as obscene, defamatory, or intended to incite violence will be removed. If you find a comment offensive, you may flag it.
When posting a comment, you agree to our Terms of Use.
