


-
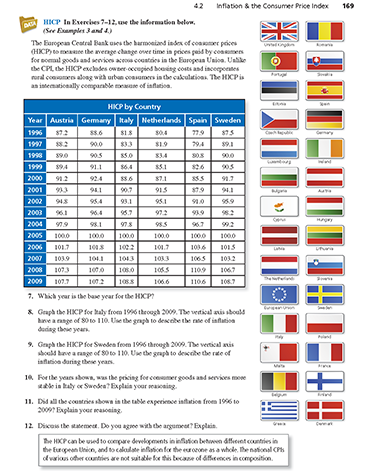
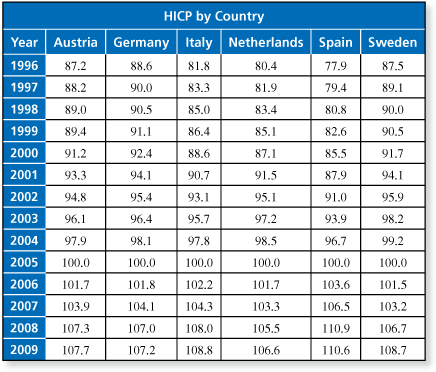
The European Central Bank uses the harmonized index of consumer prices (HICP) to measure the average change over time in prices paid by consumers for normal goods and services across countries in the European Union. Unlike the consumer price index (CPI), the HICP excludes owner-occupied housing costs and incorporates rural consumers along with urban consumers in the calculations. The HICP is an internationally comparable measure of inflation.
Which year is the base year for the HICP? (See Example 3 and Example 4.)

-
The base year is 2005. Each index in that year is 100.
Comments (0)These comments are not screened before publication. Constructive debate about the information on this page is welcome, but personal attacks are not. Please do not post comments that are commercial in nature or that violate copyright. Comments that we regard as obscene, defamatory, or intended to incite violence will be removed. If you find a comment offensive, you may flag it.
When posting a comment, you agree to our Terms of Use.Showing 0 commentsSubscribe by email Subscribe by RSSThere are no comments. -
-
The European Central Bank uses the harmonized index of consumer prices (HICP) to measure the average change over time in prices paid by consumers for normal goods and services across countries in the European Union. Unlike the consumer price index (CPI), the HICP excludes owner-occupied housing costs and incorporates rural consumers along with urban consumers in the calculations. The HICP is an internationally comparable measure of inflation.
Graph the HICP for Italy from 1996 through 2009. The vertical axis should have a range of 80 to 110. Use the graph to describe the rate of inflation during these years. (See Example 3 and Example 4.)
These comments are not screened before publication. Constructive debate about the information on this page is welcome, but personal attacks are not. Please do not post comments that are commercial in nature or that violate copyright. Comments that we regard as obscene, defamatory, or intended to incite violence will be removed. If you find a comment offensive, you may flag it.
When posting a comment, you agree to our Terms of Use. -
The European Central Bank uses the harmonized index of consumer prices (HICP) to measure the average change over time in prices paid by consumers for normal goods and services across countries in the European Union. Unlike the consumer price index (CPI), the HICP excludes owner-occupied housing costs and incorporates rural consumers along with urban consumers in the calculations. The HICP is an internationally comparable measure of inflation.
Graph the HICP for Sweden from 1996 through 2009. The vertical axis should have a range of 80 to 110. Use the graph to describe the rate of inflation during these years. (See Example 3 and Example 4.)
-
You can use a spreadsheet to make the graph.
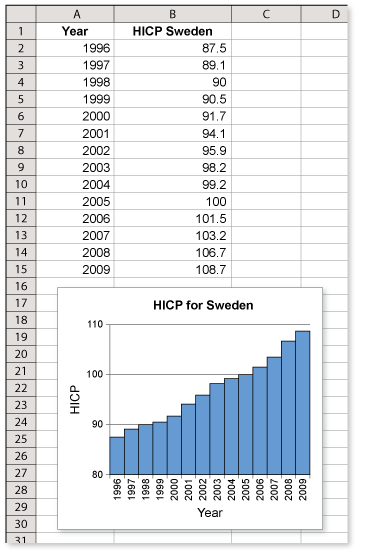
From the graph, you can see that inflation in Sweden from 1996 to 2009 increased at a steady rate.
These comments are not screened before publication. Constructive debate about the information on this page is welcome, but personal attacks are not. Please do not post comments that are commercial in nature or that violate copyright. Comments that we regard as obscene, defamatory, or intended to incite violence will be removed. If you find a comment offensive, you may flag it.
When posting a comment, you agree to our Terms of Use. -
-
The European Central Bank uses the harmonized index of consumer prices (HICP) to measure the average change over time in prices paid by consumers for normal goods and services across countries in the European Union. Unlike the consumer price index (CPI), the HICP excludes owner-occupied housing costs and incorporates rural consumers along with urban consumers in the calculations. The HICP is an internationally comparable measure of inflation.
For the years shown, was the pricing for consumer goods and services more stable in Italy or Sweden? Explain your reasoning. (See Example 3 and Example 4.)
These comments are not screened before publication. Constructive debate about the information on this page is welcome, but personal attacks are not. Please do not post comments that are commercial in nature or that violate copyright. Comments that we regard as obscene, defamatory, or intended to incite violence will be removed. If you find a comment offensive, you may flag it.
When posting a comment, you agree to our Terms of Use. -
The European Central Bank uses the harmonized index of consumer prices (HICP) to measure the average change over time in prices paid by consumers for normal goods and services across countries in the European Union. Unlike the consumer price index (CPI), the HICP excludes owner-occupied housing costs and incorporates rural consumers along with urban consumers in the calculations. The HICP is an internationally comparable measure of inflation.
Did all the countries shown in the table experience inflation from 1996 to 2009? Explain your reasoning. (See Example 3 and Example 4.)
-
Yes, they all did experience inflation from 1996 to 2009. The rate of inflation, however, differed. Of the 6 countries shown, Spain had the greatest inflation and Germany had the least.
These comments are not screened before publication. Constructive debate about the information on this page is welcome, but personal attacks are not. Please do not post comments that are commercial in nature or that violate copyright. Comments that we regard as obscene, defamatory, or intended to incite violence will be removed. If you find a comment offensive, you may flag it.
When posting a comment, you agree to our Terms of Use. -
-
Discuss the statement. Do you agree with the argument? Explain. (See Example 3 and Example 4.)
The HICP can be used to compare developments in inflation between different countries in the European Union, and to calculate inflation for the eurozone as a whole. The national CPIs of various other countries are not suitable for this because of differences in composition.
These comments are not screened before publication. Constructive debate about the information on this page is welcome, but personal attacks are not. Please do not post comments that are commercial in nature or that violate copyright. Comments that we regard as obscene, defamatory, or intended to incite violence will be removed. If you find a comment offensive, you may flag it.
When posting a comment, you agree to our Terms of Use.